Chapter 2: Parameters
This chapter is organized as a self-contained paper:
Spielauer, Martin, Thomas Horvath, Walter Hyll, Marian Fink (2020) microWELT: Socio-Demographic Parameters and Projections for Austria, Spain, Finland, and the UK WIFO Working Paper 6011/2020 pdf
Abstract
The aim of this chapter is twofold. First, it provides an overview of the socio-demographic core modules of the dynamic microsimulation model microWELT. Second, it describes the essential socio-demographic characteristics of four European countries - Austria, Spain, Finland, and Great Britain as representatives of four welfare state regimes (conservative, Mediterranean, universalistic, and liberal) - and the processes that drive socio-demographic change which we aim at capturing with the model. MicroWELT is developed as a tool for the comparative study of the distributional effects of four welfare state regimes, represented by the four studied countries. Processes with potential links to welfare state types include (1) the intergenerational transmission of education, (2) childlessness and fertility by education, (3) partnership behaviours and lone parenthood, (4) age at leaving home, and (5) mortality differentials by sex and education. Through microWELT projections, we identify the impact of these processes on the future population composition by age, sex, education, and family characteristics of the studied countries.
Introduction
This chapter identifies essential socio-demographic characteristics of four European countries – Austria, Spain, Finland, and the UK - and the processes driving socio-demographic change which we aim at capturing in the microWELT model. microWELT is a comparative dynamic microsimulation model developed at the Austrian Institute of Economic Research (WIFO) alongside the research program WELTRANSIM (Welfare Transfer Simulation). It allows studying the distributional effects of four welfare state regimes represented by the four studied countries.
microWELT reproduces Eurostat population projections concerning age-specific fertility, mortality, as well as net migration. While meeting these aggregate targets, the model also produces detailed family-demographic and education projections. Modelled processes have potential links to welfare state types, including the intergenerational transmission of education, childlessness and fertility by education, partnership behaviours and lone parenthood, age at leaving home, and mortality differentials by sex and education. Through microWELT projections, we identify the impact of these processes on the future population composition by age, sex, education, and family characteristics of the studied countries.
This chapter is organized as follows. The first part gives an overview of the microWELT model and its rational and application from the perspective of the presented research. This part is kept very short, as detailed documentation of the model and its implementation are available at the project website (microWELT.eu). In the following – departing from Eurostat population projections of fertility, mortality, and migration - we discuss how demographic processes are modelled and parameterized in microWELT. We continue with a discussion of the inter-generational transmission of education, partnership patterns, and leaving home. The final part presents detailed simulation results and how differences in the various behaviours across the studied countries impact these results.
All parameter tables and the simulation results of the base scenario (organized in around 60 tables) for the four studied countries are available as Excel workbooks at the project website. Parameters are estimated and generated by a set of documented Stata scripts that are also available for download. Besides transparent model documentation and reproducibility, the scripts also facilitate porting the model to new countries.
The microWELT model
microWELT is a dynamic microsimulation platform developed for the study of the interactions between welfare state regimes, private and public welfare transfers, and population ageing accounting for educational change, life expectancy differentials by education, and changing family patterns.
microWELT is a portable continuous-time interacting population model based on data readily available for many countries, most importantly, the EUROMOD database. While reproducing existing (Eurostat) demographic projections in aggregate outcomes, microWELT also produces detailed family-demographic and education projections integrated with a longitudinal accounting framework based on the National Transfer Account (NTA) approach. microWELT is fully documented and designed as a modular platform refinable and extendable for a wide range of applications going beyond the WELTRANSIM project.
The starting population is generated from 2010 EUROMOD (Sutherland and Figari, 2013) input data, and various parameters are estimated directly from this data set. Other data sources are the harmonized European Labour Force Survey, Eurostat projections, NTA variables by age and sex, developed in the Agenta Project (agenta-project.eu), and new disaggregated NTA data by age, sex, education, and family type developed within the WELTRANSIM project (weltransim.eu).
microWELT reproduces Eurostat population projections concerning age-specific fertility, mortality rates by age and sex, and net migration numbers by age and sex. While meeting these aggregate targets due to alignment, the model accounts for the relative differences in rates by education. In particular, first, birth rates (and thereby childlessness) are modelled by education. Also, the model accounts for the relative differences in mortality by education, resulting in observed life expectancy differentials, while overall results are aligned to mortality by age and sex. microWELT models the intergenerational transmission of education, which improves the longitudinal consistency of economic accounting over the life-course. For example, a person achieving higher education has a higher likelihood of having grown up with higher educated parents, thus having received higher family transfers as a child. Education (besides age, the presence of children in the family, and the age of the youngest child) also impacts the likelihood of a woman living in a partnership. In the simulation, partners are matched by observed distributions by age and education. Persons are linked to nuclear families. These links are maintained, responding to events like union formation, new partnerships, leaving home, and death.
Population Projections
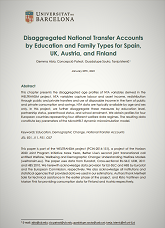
One of the key features of microWELT is its inbuilt ability to reproduce existing population projections in aggregate outcomes such as age-specific fertility, mortality by age and sex, and net migration by age and sex. Figure 1 depicts the very different demographic patterns concerning the changes in the number of births, deaths, net migration, and the resulting total population across the studied countries. Except for the UK, births surpass the number of deaths starting around 2020. While migration stabilizes the total population in Austria and Spain, the Finish population starts declining from this point in time. In contrast, the UK has projected numbers of births above the number of deaths leading to a steady increase in the total population.
Figure 1: Births, deaths, net migration, and total population
Source: microWELT projection results of the base scenario closely reproducing Eurostat population projections.
Basic population projection parameters

-   Fertility rates by age and year
-   Gender ratio
-   Mortality rates by year, age, and sex
-   Net migration rates by year, age, and sex
Fertility
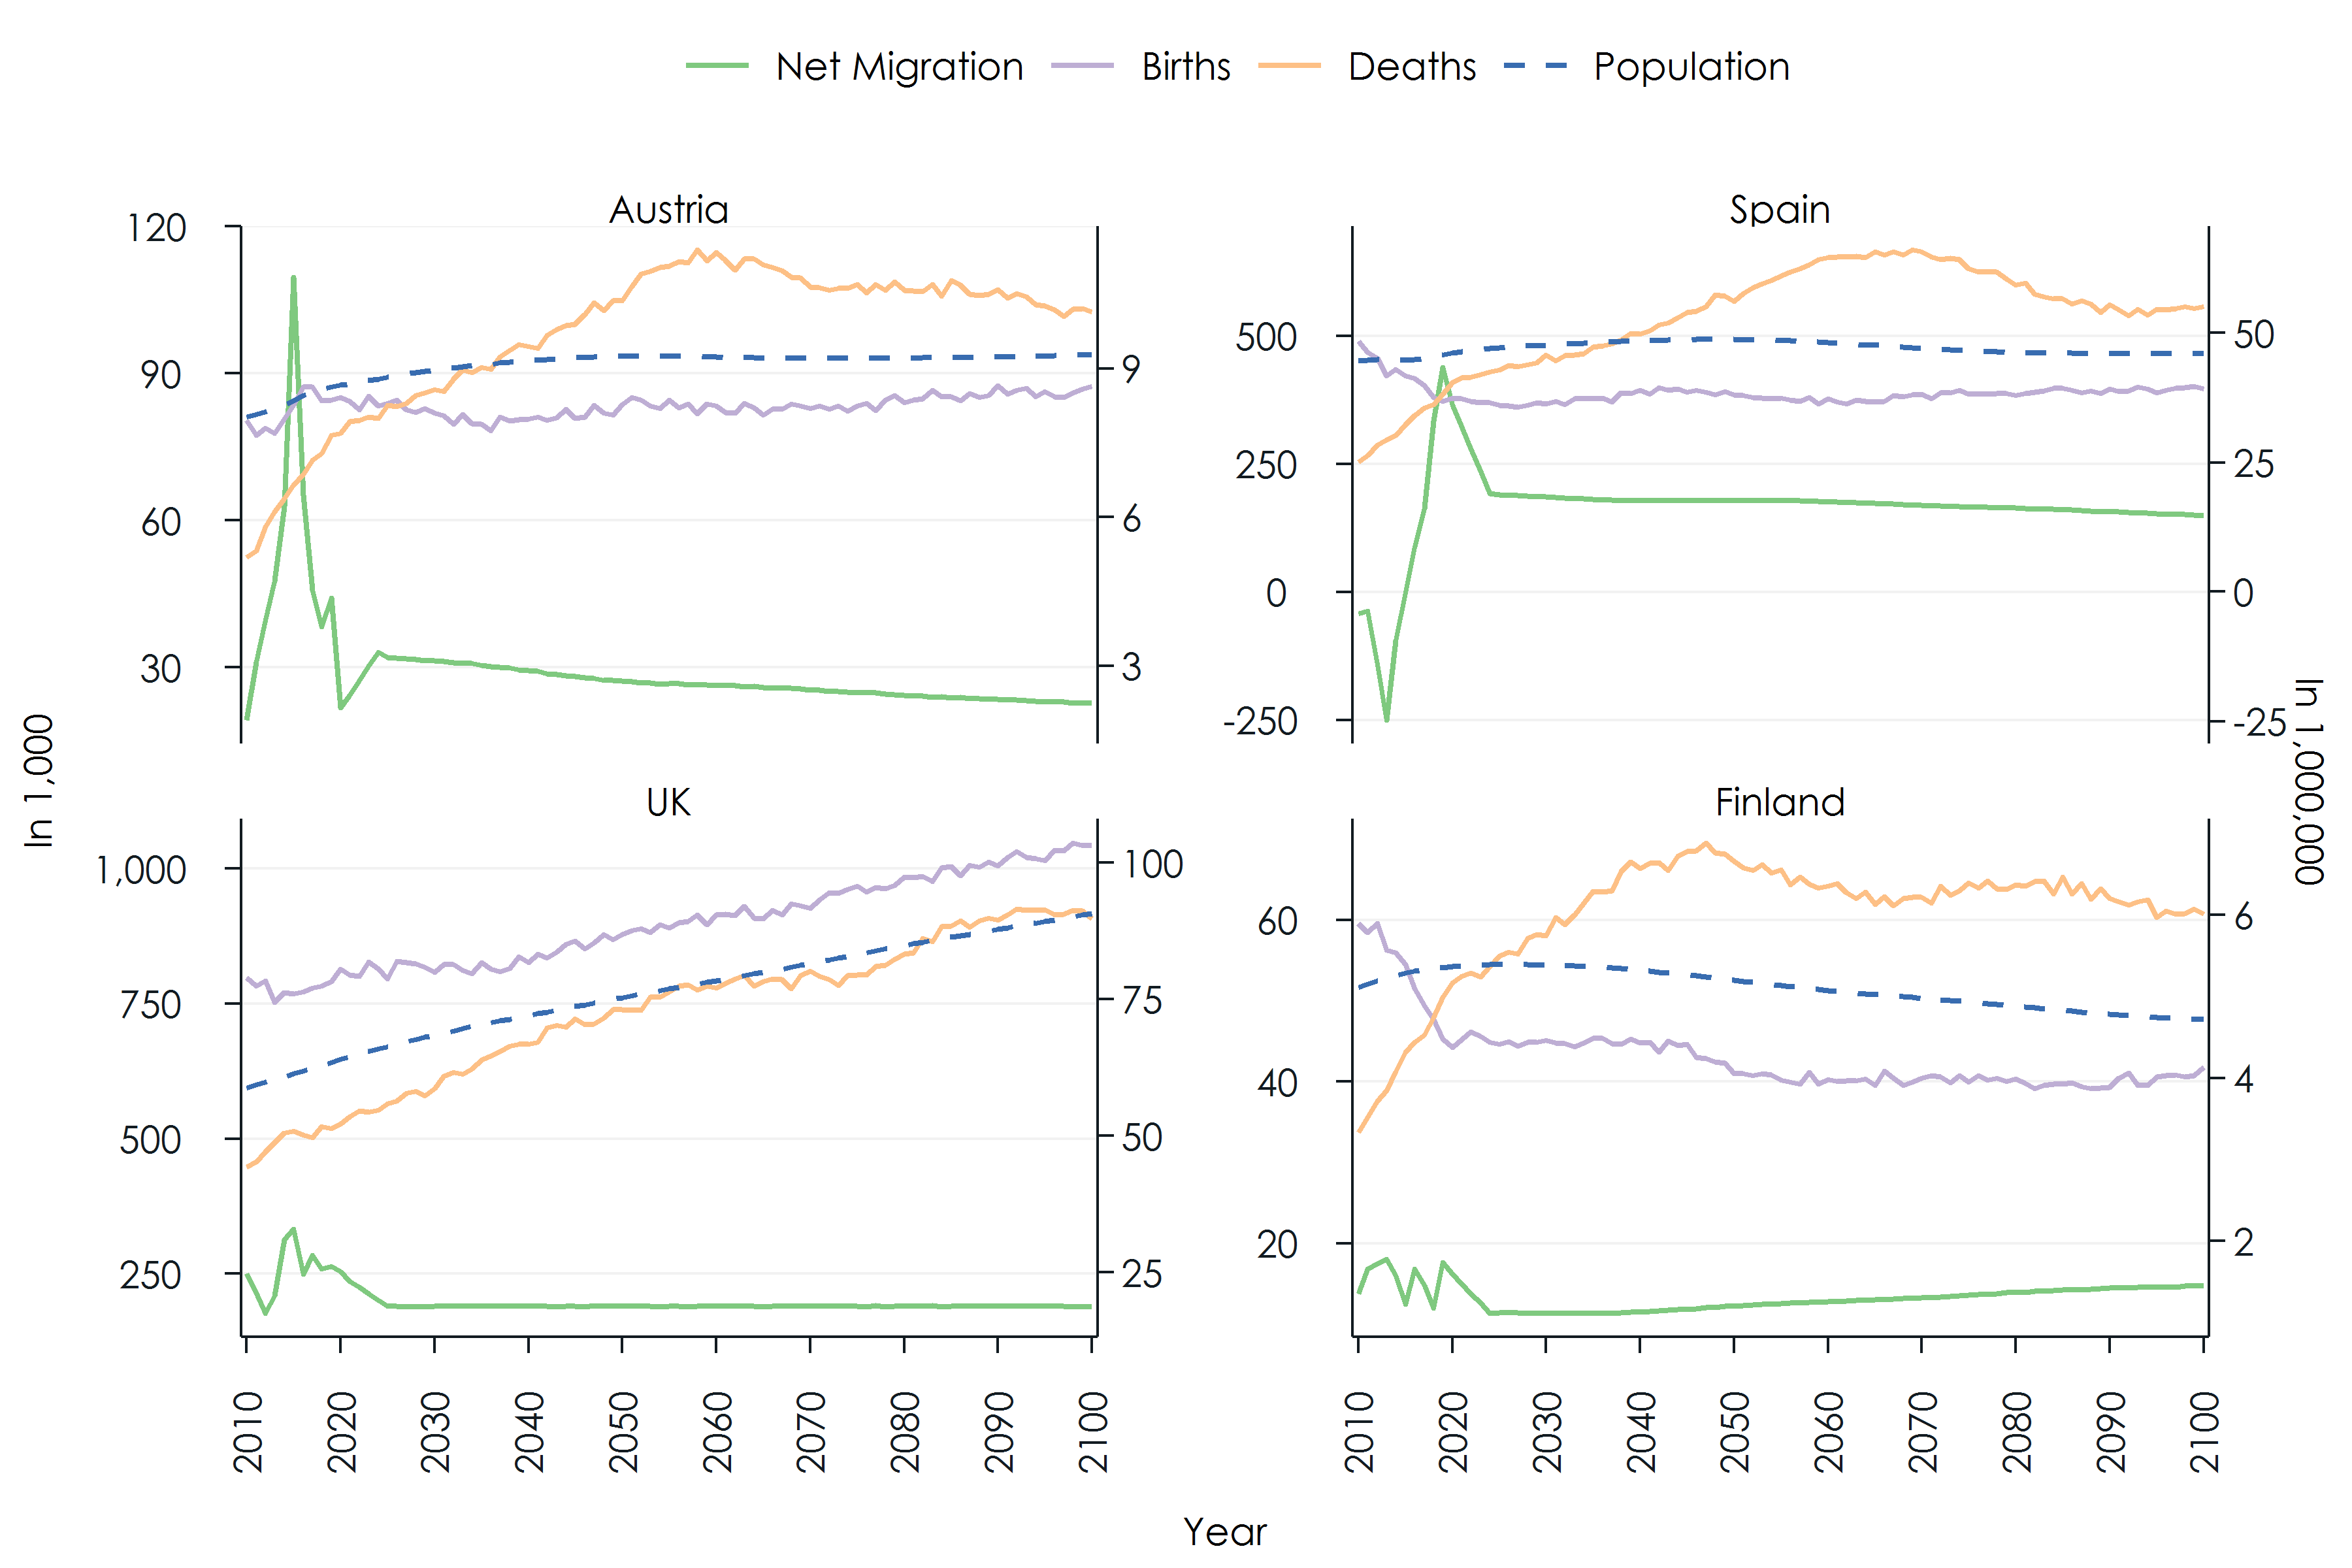
In its base scenario, microWELT reproduces age-specific fertility rates by calendar year as published and projected by Eurostat. Figure 2 illustrates the different levels and age patterns observed in 2010 and as projected for 2030. Besides a slight move to higher ages, fertility is projected to stay at around 2010 levels for Austria and Spain (resulting in a Total Fertility Rate TFR around 1.4 and 1.3). The Finish rates drop from a comparably high level (resulting in a TFR of 1.9) to levels comparable to Austria. Rates for the UK stay comparably high (resulting in a TFR of 1.8, a drop from 1.9). The slight drop of fertility in the UK is caused primarily by a projected reduction of fertility younger women, which is currently comparably high.
Figure 2: Historical (2010) and projected (2030) age-specific fertility rates
Source: Eurostat.
In contrast to macro projection models, microWELT does not apply the same fertility rates to all women regardless of education and parity. In order to simultaneously meeting overall rates and accounting for individual differences, first births are modelled separately, parameterized by age-specific cohort first birth rates by education. As a model option, these rates can be automatically calibrated to meet an additional parameter for cohort childlessness by education. In the simulation, it is ensured that first births meet these rates. In contrast, the remaining (higher-order) births required to meet overall age-specific fertility are distributed randomly to women of the respective age who are already mothers.
The rationale of this approach is to meet two critical targets of fertility – the age distribution at first birth and childlessness by education - while being able to reproduce overall age-specific fertility rates. Childlessness (versus ever being a parent) is a key distinguishing characteristic of the model. It is also applicable for distributional analysis from a longitudinal perspective (accounting transfers over the whole life course by population group). Childlessness differs by education following patterns also linked to welfare state regimes. For example, high childlessness of higher educated women is seen as a typical phenomenon of “specialization” in conservative countries (Spielauer 2005). Historically, most European countries followed a transition of very high childlessness at the beginning of the 20th century to very low childlessness during the baby boom, followed by an increase. As a measure of the concentration of reproduction – the distribution of family sizes – it impacts the distribution of family obligations, which are an essential dimension of distributional analysis (Shkolnikov et al. 2004, Spielauer 2005).
microWELT reproduces these patterns and allows scenarios for the future. In the base scenario, we maintain the cohort childlessness of the 1960 birth cohort. Parameters stem from the Cohort Fertility and Education database (http://www.cfe-database.org/database/) for Austria, Finland, and Spain. Data for the UK are taken from Berrington et al. (2015). While total levels of childlessness are comparable across the four studied countries, childlessness by education follows different patterns. For Austria, Spain, and the UK childlessness is highest for women with high education. For Finland, cohort trends have reversed, childlessness now being highest among women with low education. This reversal is unique, also in the context of Nordic countries, whereas in all Nordic countries women with high education do have lower levels of childlessness compared to the rest of Europe (Rotkirch & Miettinen 2017).
Figure 3: Cohort childlessness
Source: Cohort fertility and education database (Austria, Finland, and Spain) and Berrington et al. (2015) for the UK.
First birth rates by education were estimated from EUROMOD SILC data and calibrated to reproduce the target cohort childlessness.
Figure 4: Childlessness by education and age 2060 (i.e., women born in the simulation)
Source: microWELT simulation results – base scenario of constant fertility patterns.
Fertility Parameters (other than the basic population projection parameters)

Model selection:
  (1) Basic model: Fertility according to age-specific fertility rates (AFR)
  (2) Refined model: First births by education, with alignment to AFR

-  First birth rates by age, education, and year of birth
-  Target childlessness by education and year of birth
-  Y/N Selection switch to align first birth rates to the
   cohort childlessness parameter
Mortality
The modelling of mortality is based on mortality tables available from Eurostat population projections. In addition to age- and gender-specific mortality, the model considers the different life expectancies according to education. For example, in Austria, men with university degrees live on average about six years longer than men with compulsory schooling as the highest level of education (Klotz, 2007; Leoni et al. 2020). The simulation uses parameters for the average remaining life expectancy at 25 and 65 by education (Murtin et al. 2017) to calculate relative mortality risks. It applies them in such a way that overall consistency with the mortality tables is maintained. The ability to model life expectancy differences by education is critical for projections of transfers, particularly pension transfers, which are higher for higher educated people.
Figure 5: Remaining life expectancy at 25 and 65
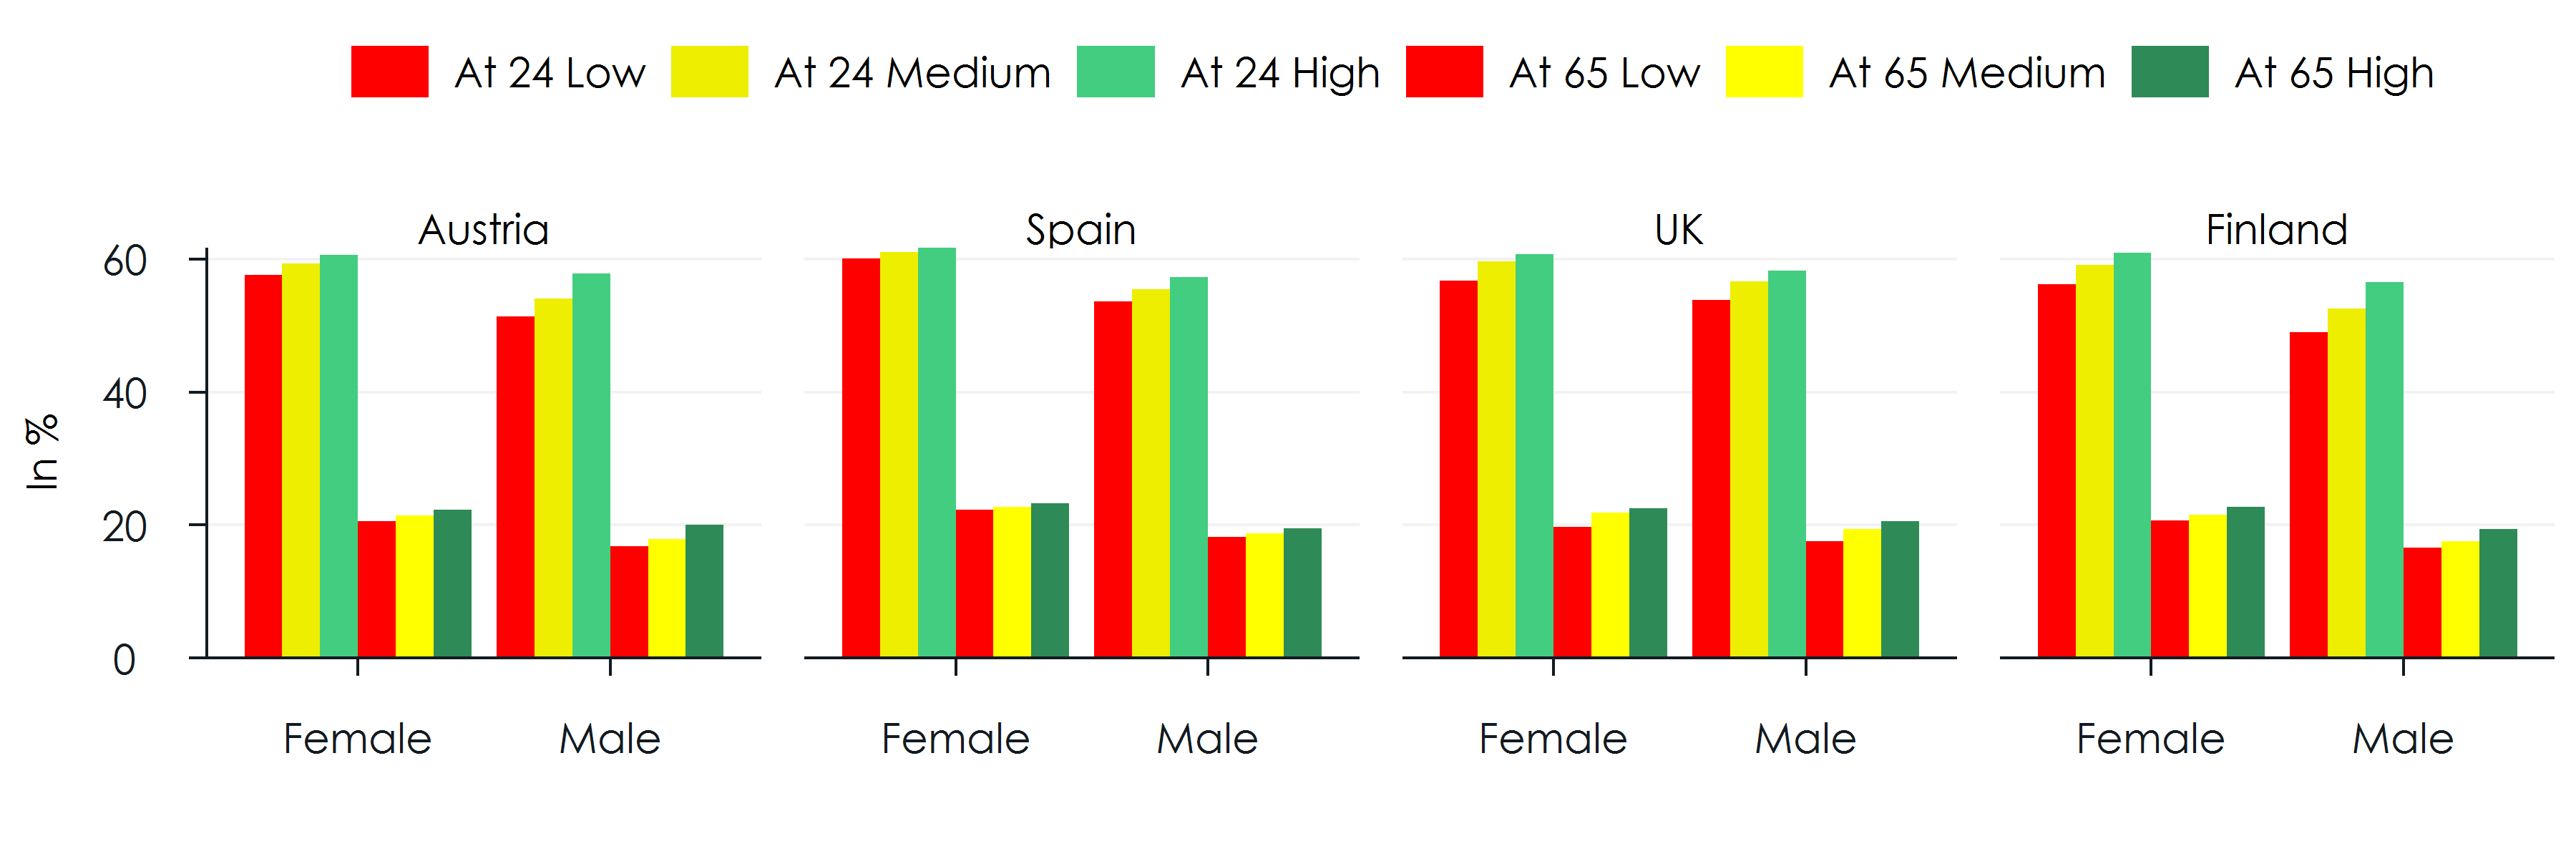
Source: Model parameter based on Murtin et al. (2017). Data for Spain are based on Requena (2017).
Mortality improvements captured in the projected period life tables lead to a cohort life expectancy higher than today’s period estimates. Figure 6 shows the expected cohort life expectancy at birth by country, sex, and education of people born 2010-2014. In general, life expectancy differences by education are more pronounced for men.
Figure 6: Simulated life expectancy of 2010-2014 birth cohorts accounting for mortality improvements according to Eurostat projections
Source: Eurostat. Own calculation.
Mortality Parameters (other than the basic population projection parameters)

-  Model selection:
   (1) Life table: projected mortality rates by year, age, and sex
   (2) Life table calibrated to remaining life expectancy at 25 and 65 for each year
   (3) Same as (2), with overall mortality aligned to the mortality table as in (1)
-  Remaining life expectancy at 25 and 65 by education, year, and sex
School Enrolment, Education Outcome, and the Intergenerational Transmission of Education
microWELT distinguishes three levels of education, low corresponding to ISCED 0-2, medium to 3-4, and high to 5+. The model aims at modelling (1) school enrolment, (2) education attainment, and (3) the intergenerational transmission of education, i.e., accounting for the influence of parents’ education (the highest level of education if living with both parents) on the education of their children. The model also allows for easy scenario creation by setting a target distribution of education outcomes by sex and year of birth. Users are given a choice to produce these target outcomes, or – from a chosen year onwards – let education change entirely be driven by the intergenerational transmission of education, i.e., the changing composition of parents’ education. For all years for which the model is set to reproduce given targets, the selection of children to progress in the education system is based on the relative differences by parents’ education expressed in odds ratios as well; however, results are aligned to the overall targets. The odds ratios were estimated for the transition (1) from lower education to medium education, and (2) from medium to high.
Table 1: Odds Ratios of education progressions by parent’s education
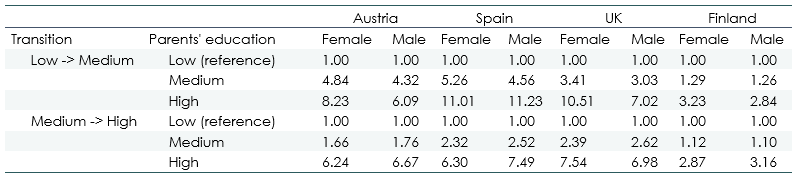
Source: Parameters estimated from the 2009 ad-hoc module of the European Labour force survey
The impact of parents’ education on education transitions is of comparable magnitude for Austria, Spain, and the UK, while in Finland, odds ratios are smaller by a factor of 3 for the transition from low to medium, and a factor of 2 for the transition from medium to high education. These diverging results for Finland are consistent with its universalistic welfare state regime. The findings are also consistent with the rankings of indices on the intergenerational educational mobility developed by OECD (2018, p248). These rankings place Austria and Spain on the low end of European countries and singling out Finland as the country with the highest mobility. This finding is also statistically significant (see Table A 5 in the Appendix).
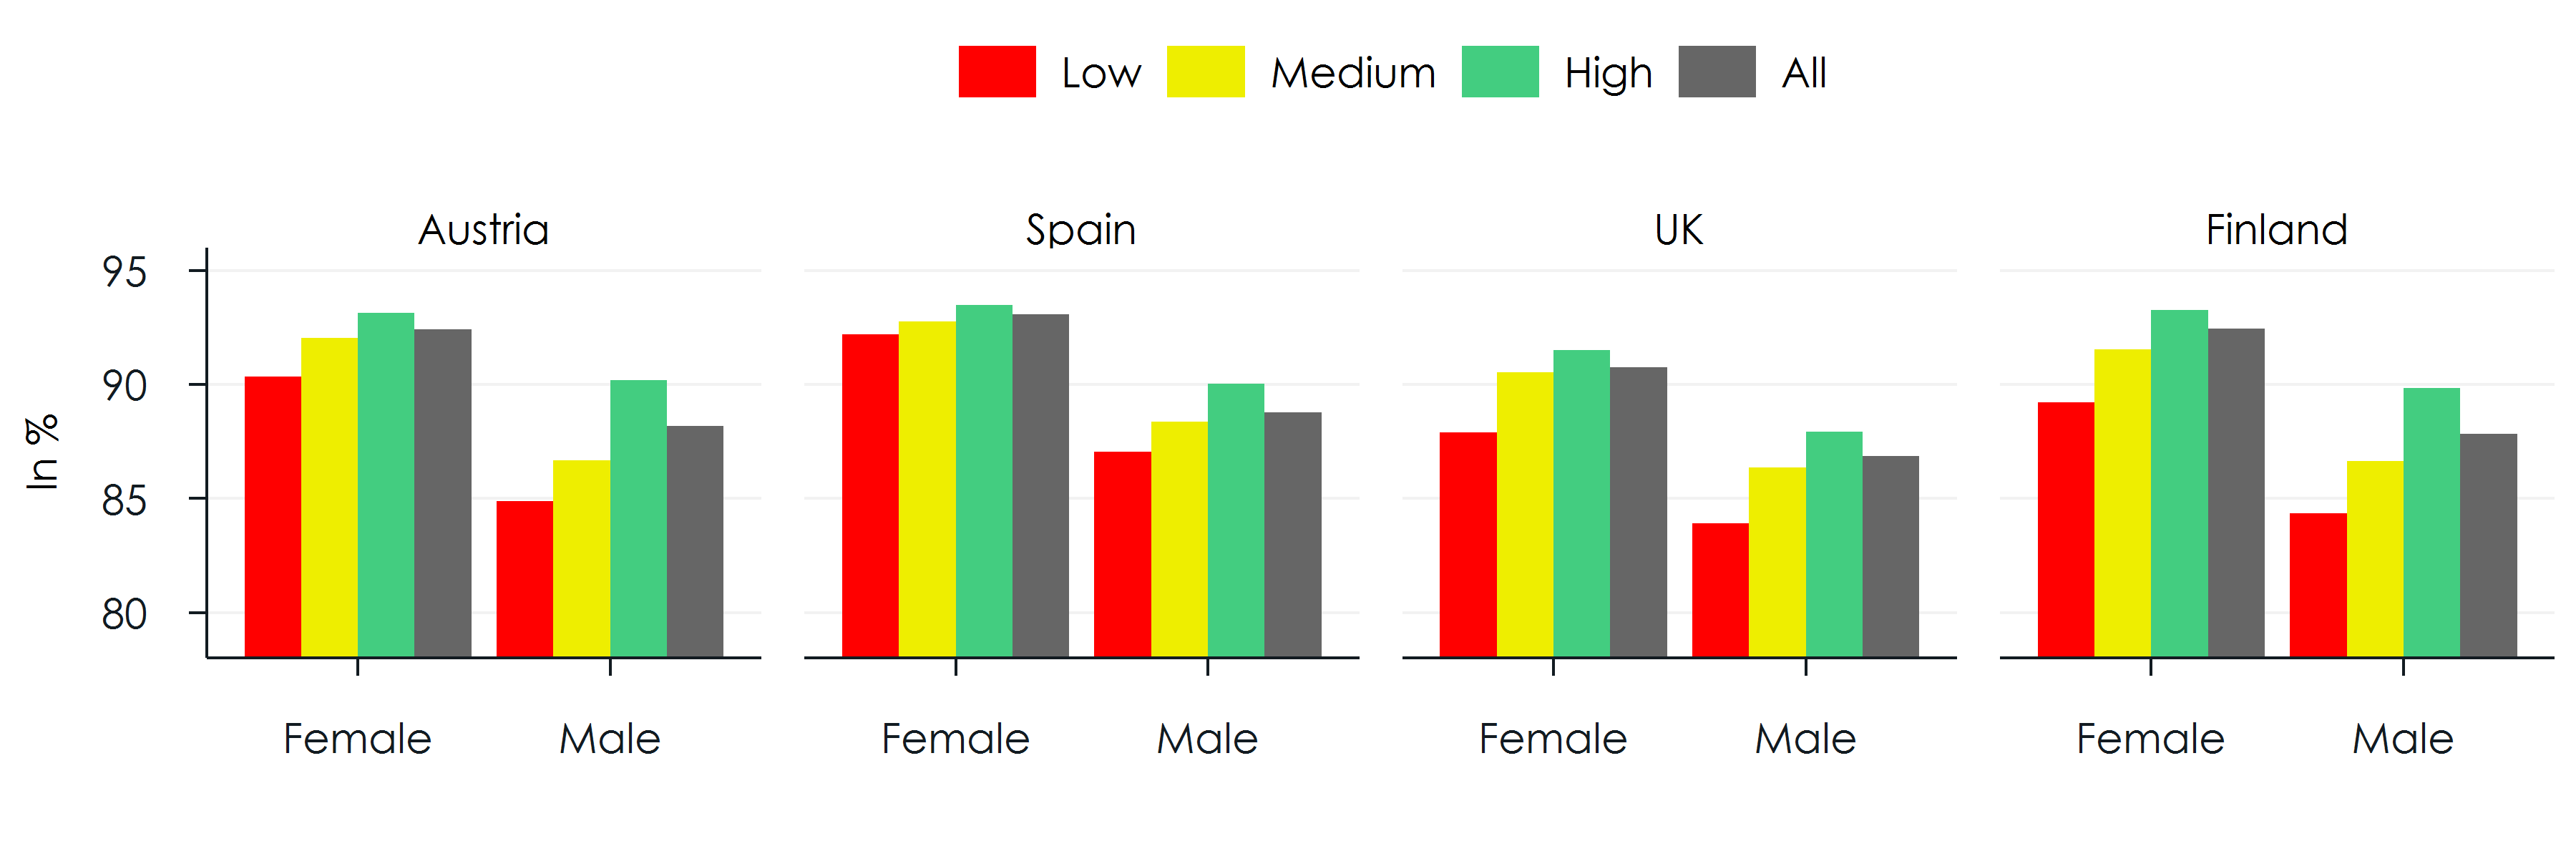
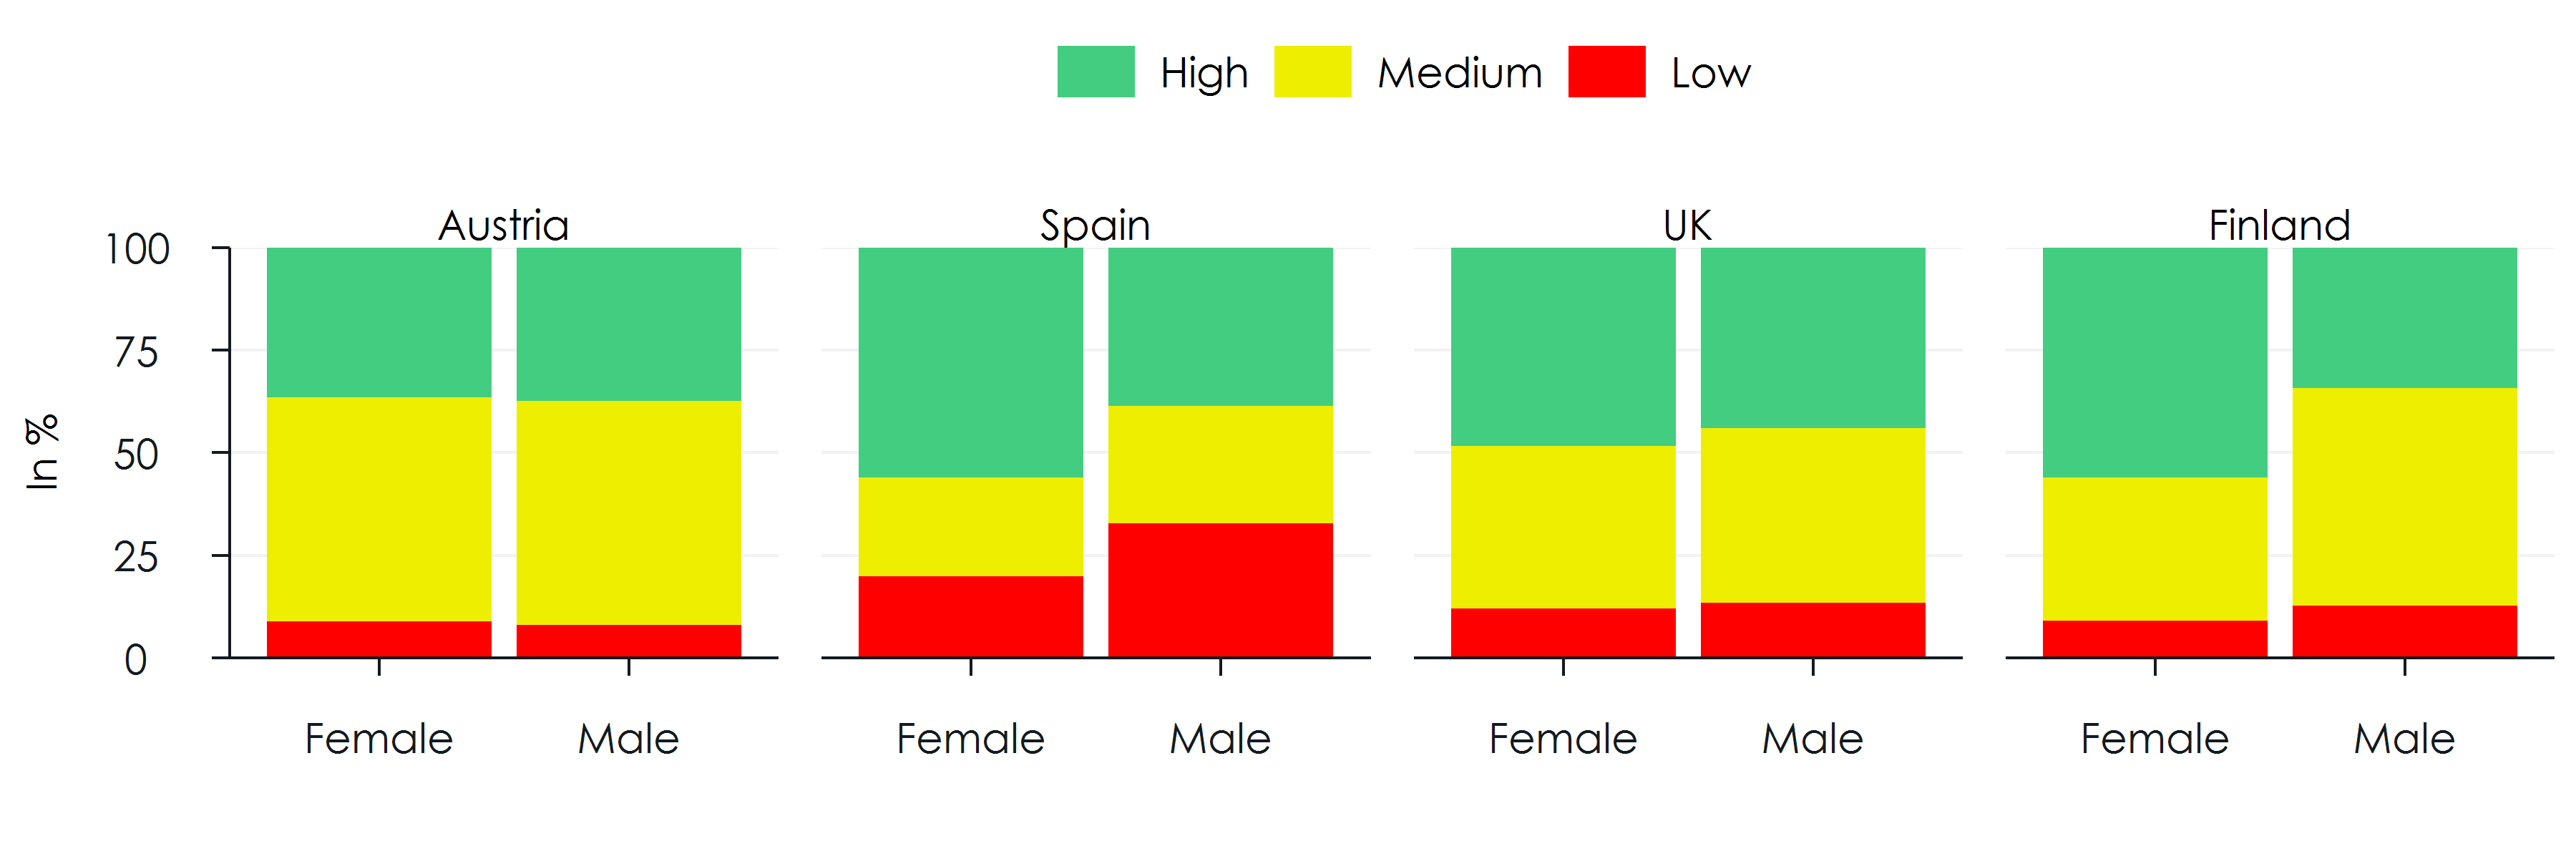
Figure 7 depicts the target education composition of the 2010 birth cohort. Most noticeable is the comparatively high proportion of low education in Spain, while the proportion of high is comparable in magnitude – and higher for women - across all countries.
Figure 7: The target education composition of the 2010 birth cohort
Source: Parameter estimated from European labour force survey data 2014.
For the given distribution of parents’ education and given relative differences in education attainments by parents’ education, the model automatically calculates transition rates that meet the target education composition of each birth cohort. All following years apply the same transition probabilities by sex and parents’ education as in the last year for which these rates were calculated within the simulation. In the base scenario, all education changes for cohorts born after 2010 are entirely driven by the changing composition of parents’ education; thus, we assume transition rates to stay constant for given sex and parents’ education.
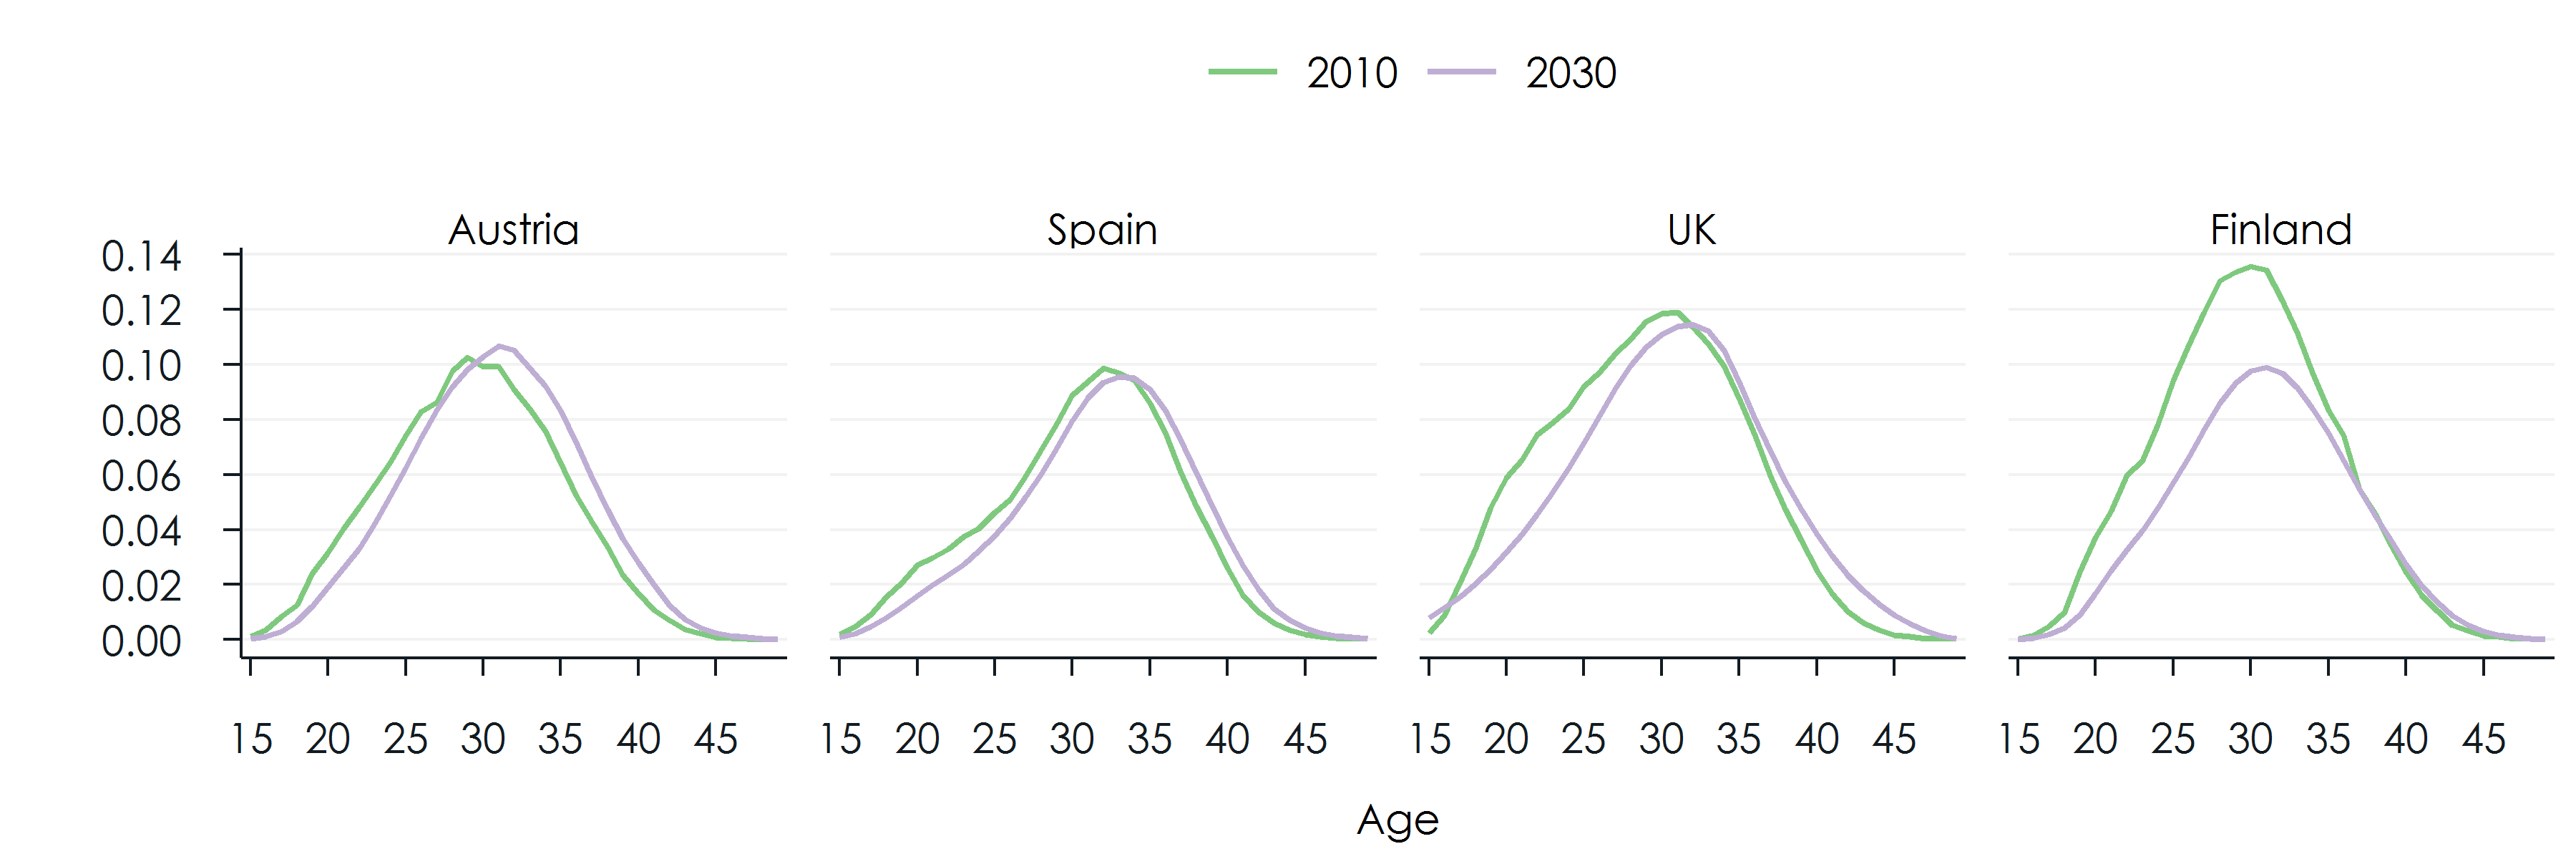
The education expansion observed in the past, and the intergenerational transmission process leads to education considerable improvements in the education composition of the potential workforce. Figure 8 depicts the resulting projected education composition of the population 25-59 from 2010 – 2060.
Figure 8: Education composition of the population 25-59 by calendar year
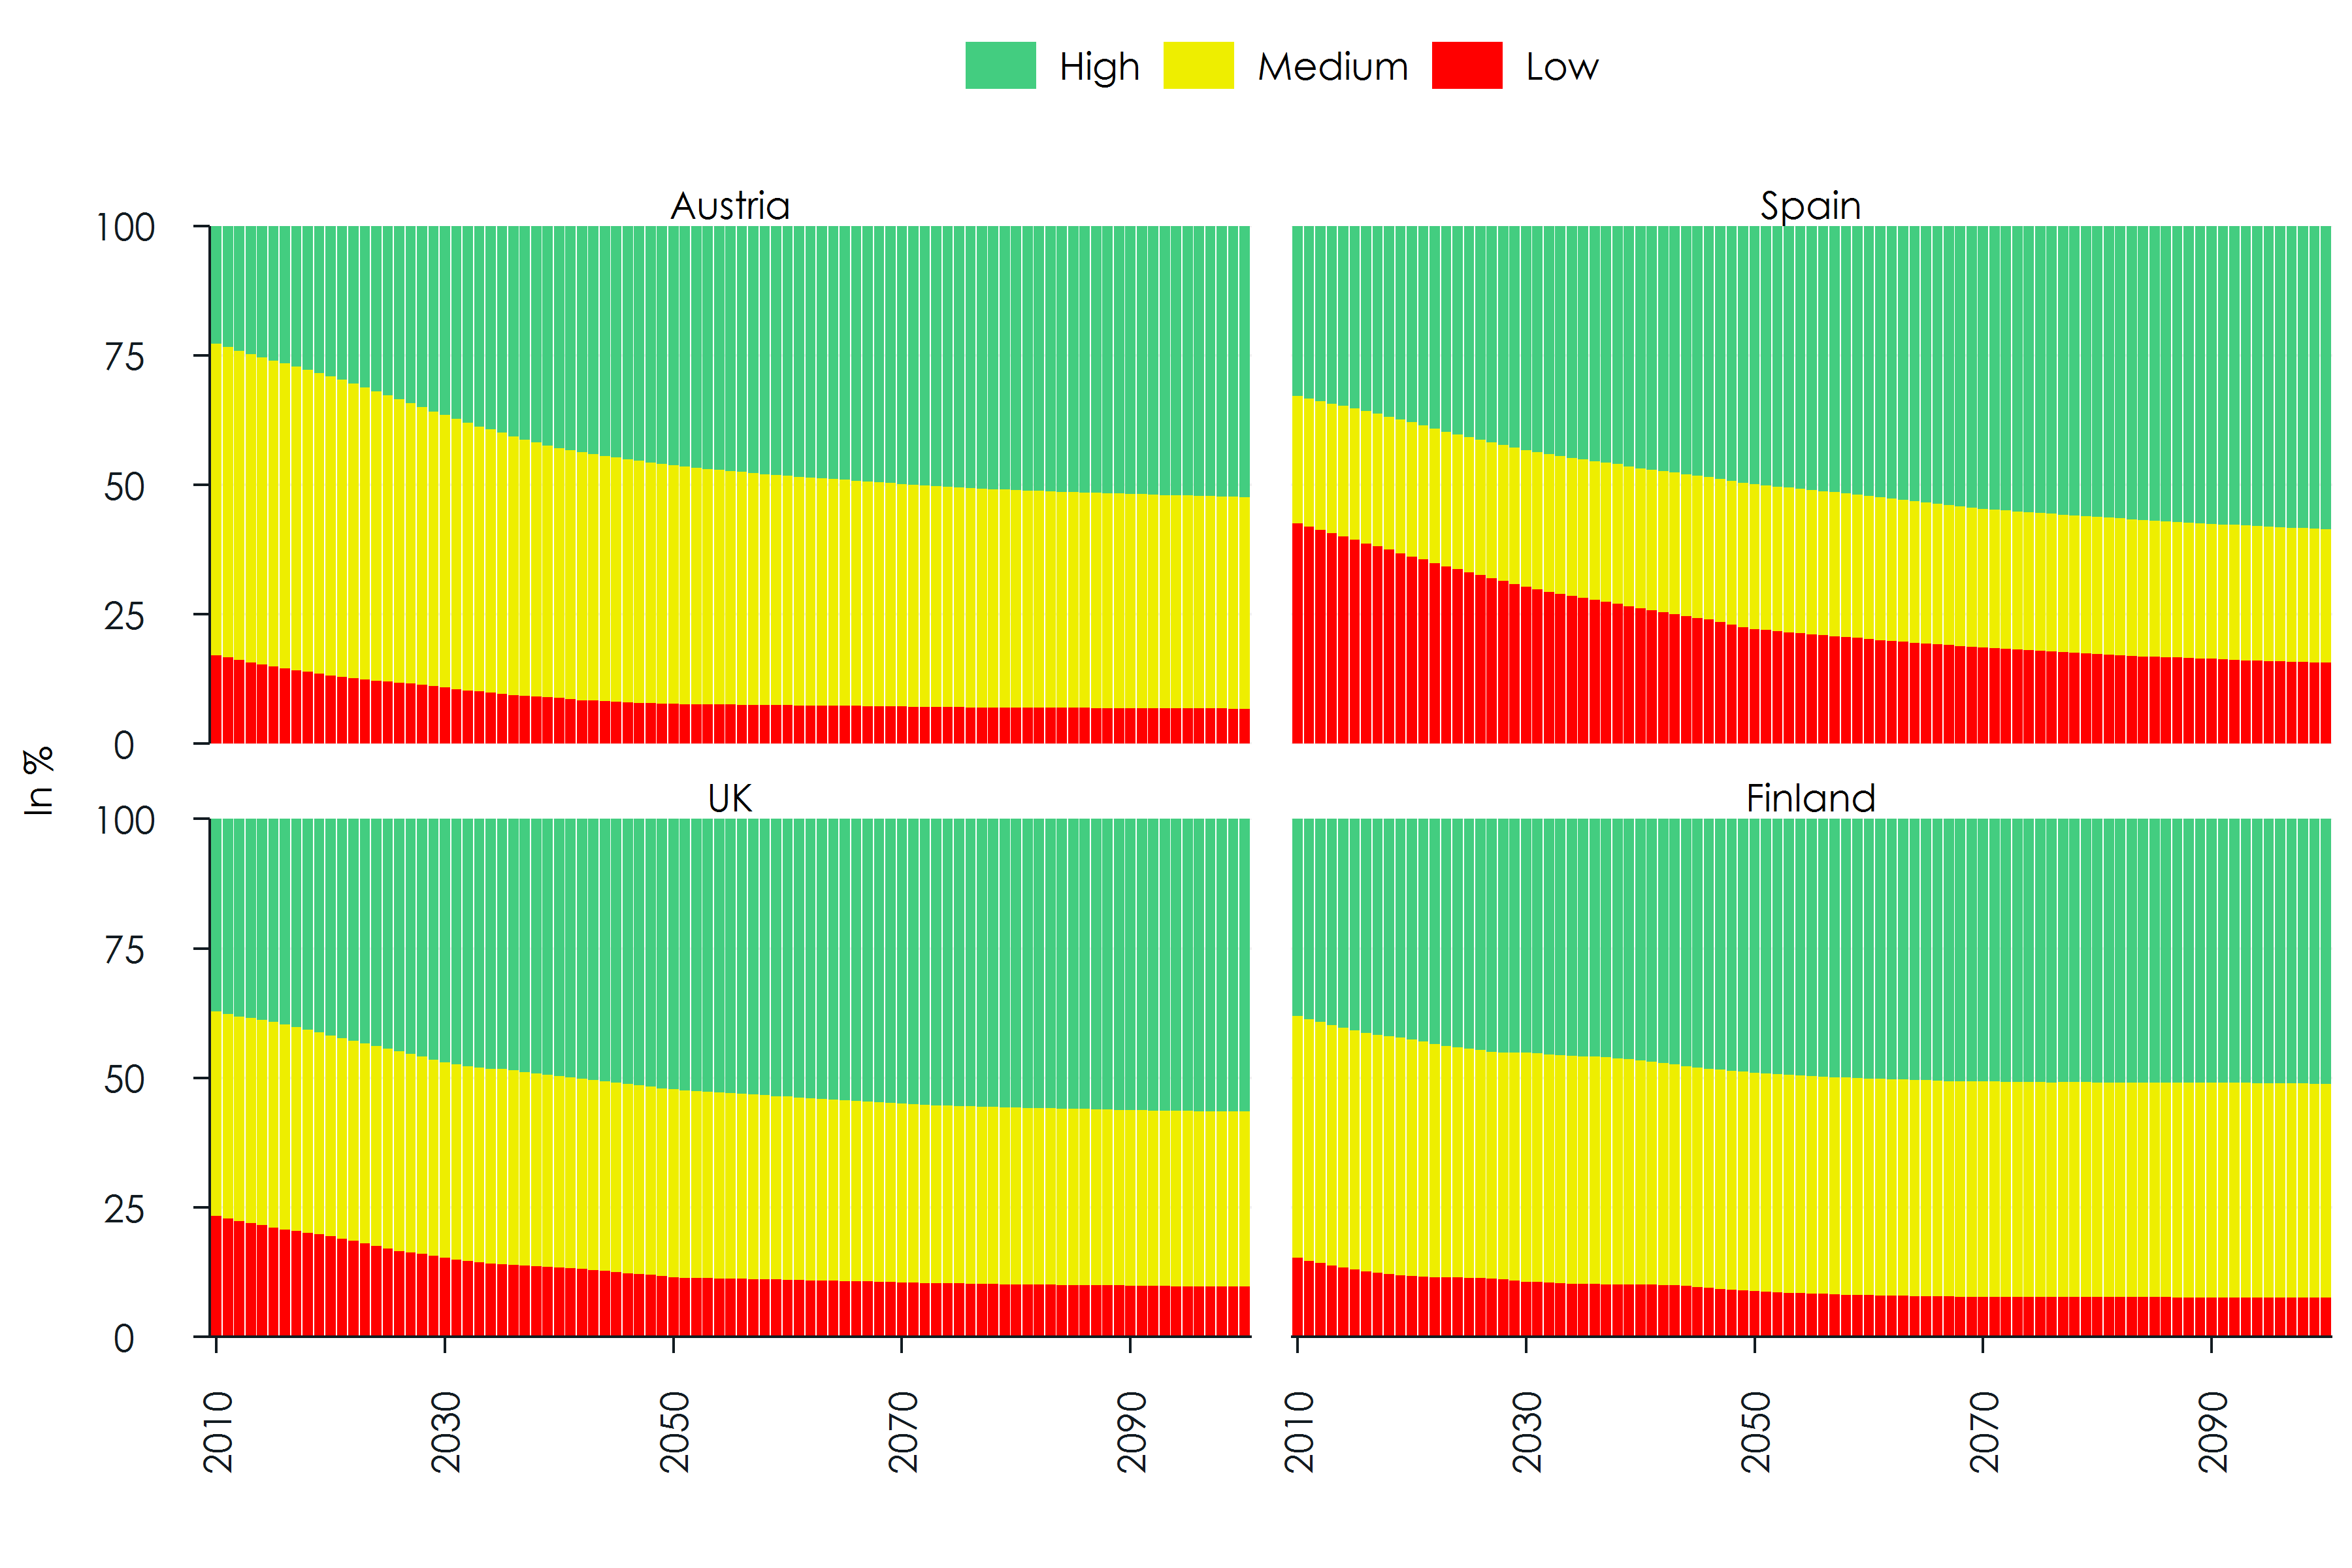
Source: microWELT simulation results – base scenario.
School enrolment is modelled by combining two mechanisms. First, based on observed current patterns of school attendance, we identified a collection of typical school trajectories (years of school attendance by school level) by education outcome together with a probability distribution of these patterns. While this approach allows a very detailed depiction of observed trajectories and their distribution in principle, the base scenario only includes trajectories up to the first high attainment. In order to also include school enrolment beyond the first high graduation, a second mechanism allows alignment of school attendance by target rates by age and sex. These rates are based on current observations, and in the simulation constitute a minimum enrolment rate.
Education Parameters

Model selection:
1. Use target outcomes without accounting for parents' education
2. Use target outcomes with accounting for parents' education
3. Same as (2), but from a selected year only model the intergenerational
   transmission

Overall outcomes:
-  Overall education progression probabilities low to medium by
   year of birth and sex
-  Overall education progression probabilities medium to high by
   year of birth and sex

Intergenerational transmission:
-  Odds ratios by parents' education for the first education progression
-  Odds ratios by parents' education for the second education progression
-  First year from which on only the intergenerational transmission is modelled

Education patterns:
-  School entry age
-  Start of the school year (e.g., September)
-  Education patterns: a collection of possible trajectories by the outcome
-  Education pattern distribution: likeliness of the various patterns
-  School enrolment rates by age and sex for optional alignment

-  School enrolment alignment on/off
Female Partnership Status and Partner Matching
The female partnership status is modelled accounting for age, education, the presence of children as well as the age of the youngest child in the family. We do not distinguish between married versus unmarried cohabitation. Once a woman enters a partnership, an appropriate male partner is searched in the population, criteria being age and education. The basic assumption of microWELT for modelling partnerships is that partnership patterns stay the same for women with given characteristics. Future changes on the aggregate level arise entirely from composition effects, for example, due to an increase in childlessness, the education expansion, or an increase in the age at first birth.
In the same way, the distributions of age differences between partners are assumed to be time-invariant. The distributions are age-dependent, their spread increasing with age. For example, while a 50-year-old woman can have a 30-year-old spouse, this age difference is not possible for a 25-year-old. Observed age patters result from past union formations with usually no data being available on the individual union durations. In consequence, the age distributions of spouses by the age of the woman observed in cross-sectional data cannot be used directly in the simulation. Instead, at each union formation event, we compare the target age distribution of spouses for women of this age (targets stemming from current cross-sectional data) with the observed age distribution within the simulation. Based on this comparison, we identify the age with the largest negative gap between the distributions and, by filling this gap, aim at keeping the distributions as close together as possible during the simulation.
For the modelling of education differences between spouses, we combine two approaches. The first uses the current distribution of partners’ education by the education of the female partner as observed for the age group 25-35. While this approach was found to clear the spouse market – virtually all women find a spouse with the characteristics based on today’s distribution in the simulation – the projected improvements in education were found to lead to implausible rates of single men by education. Given the changes in the education composition in the spouse market – and very different to today’s observations - very few men with low education would be single, while the proportion of men of high education being single would increase considerably. To address this issue, we limit the number of men available for entering a partnership for each education group based on the age profile of the share of male singles today. For example, if a 30-year-old woman with high education based on today’s distribution would randomly pick a 32-year-old spouse with medium education, but the minimum threshold of 32-year-old male singles with medium education is reached already, she would try to find a partner of another education group. As a result, the share of male singles by age and education is kept close to the proportion observed today. A presentation of the current and projected population distribution by age group, sex, family type, and education is given in Chapter 4 (Figure 13).
Except for the event of the death of a partner, the partnership status is updated in yearly steps. The death of a partner leads to an immediate update of the partnership status. Union dissolutions are modelled only until age 80; after this age, partnerships are only dissolved due to widowhood.
The probability of women to live in a partnership are estimated from the starting population file (EUROMOD SILC) using logistic regression. We estimated the models separately for women not living with dependent children and mothers.
Figure 9 depicts the partnership patterns for mothers. Single motherhood is highest for very young mothers. In the case of the UK and Finland, there is an education effect, higher educated mothers being more likely to live in a partnership. In the first years of the youngest child, lone motherhood is highest in the UK. In contrast, we observe the steepest decline of the probability of living with a partner by the age of the youngest child in Finland. These country-specific peculiarities of the UK and Finland are statistically significant (see Appendix Table A 1 to Table A 4).
Figure 9: Proportion of mothers living in a partnership by age group, education and the age of the youngest dependent child
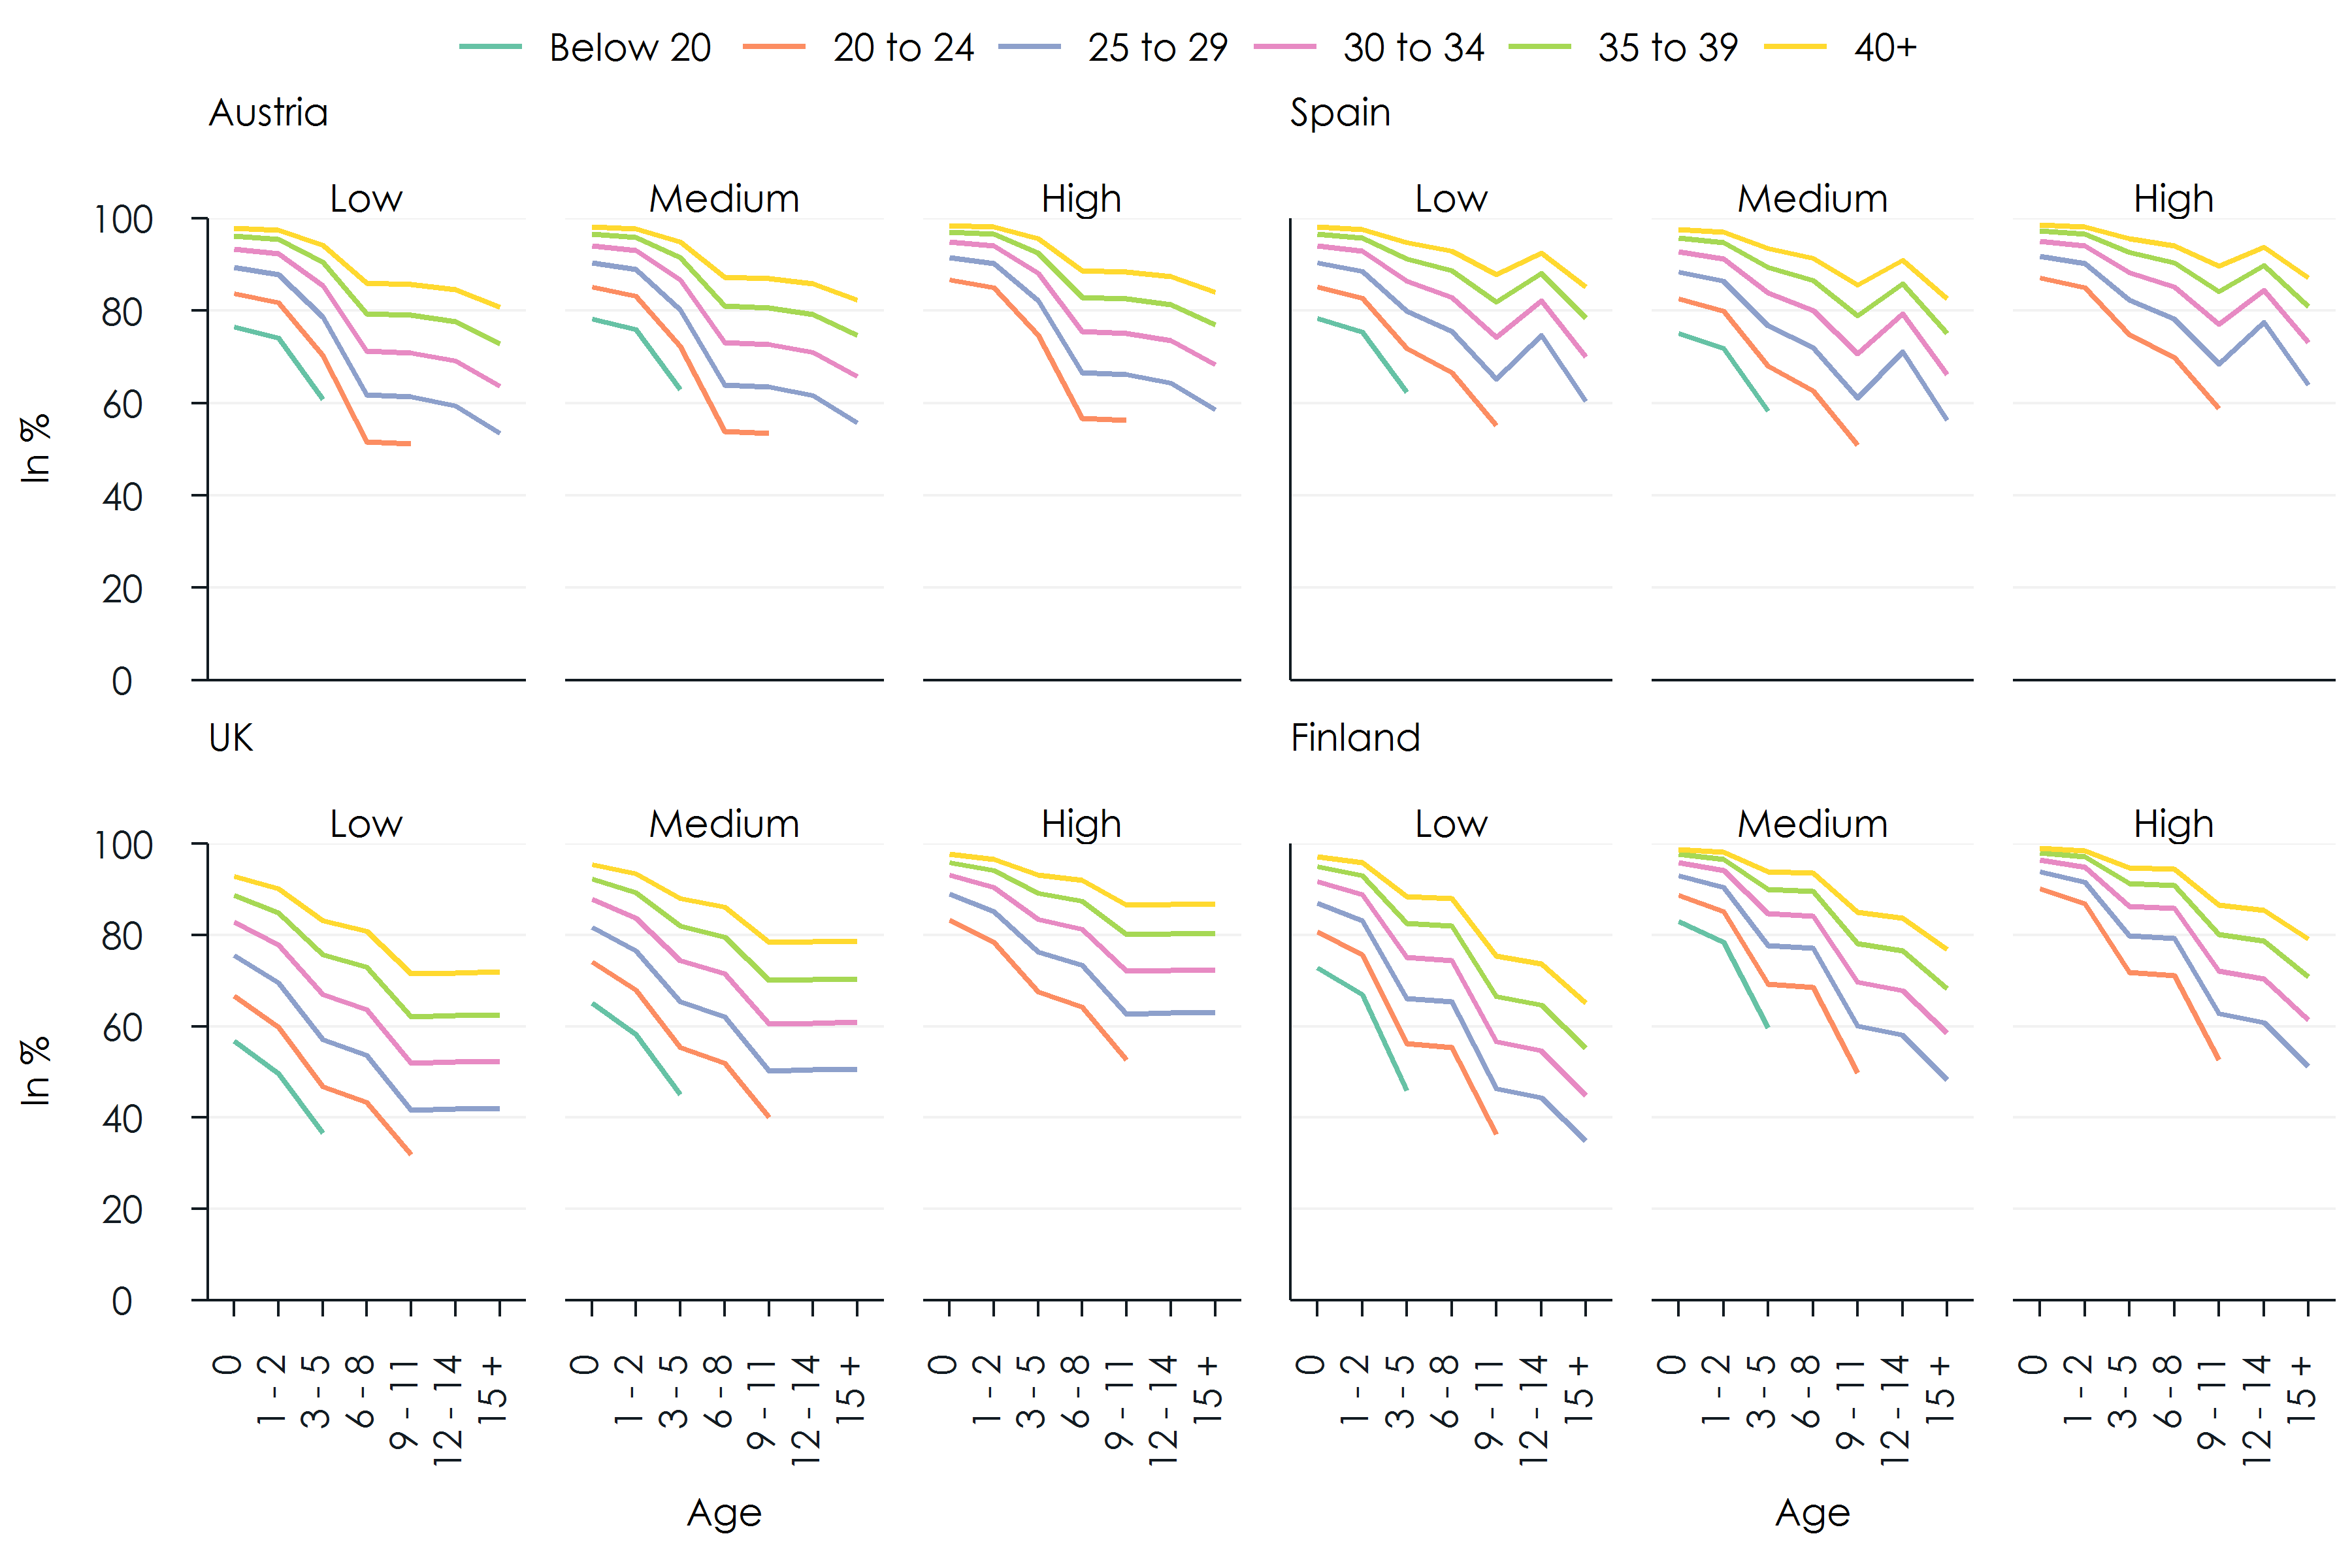
Source: Model parameters based on logistic regression results estimated from EUROMOD SILC.
While the yearly updates maintain the cross-sectional consistency of the model, individual partnership careers are not longitudinally consistent at the individual level. Union formations and dissolutions are performed only to meet the target proportions of women with given characteristics to stay in a union. If, for example, there are too many 30-year-old mothers with children below age 2 in a partnership, women of this group whose partnerships are dissolved are picked randomly until the target proportion is reached. This way, longitudinal consistency is achieved only on the cohort level. Cohorts can be distinguished by sex, year of birth, education, and childlessness which are essential dimension for the generational accounting routines implemented in microWELT.
Figure 10 displays simulation results of the lifetime family experience by education and by ever having been a mother (versus childlessness) of women born at the start of the simulation. Regardless of country, women on average spend about 40 years of their life in a partnership. Higher educated mothers in average spend less time as lone mothers, the education gradient being highest in the UK. For women who stayed childless over life, the average time spent in partnerships diminishes wit education in Austria and Spain. In contrast, no educational differences can be found for the UK and Finland.
Figure 10: Lifetime family experience (in years) by education and motherhood of women born in 2010
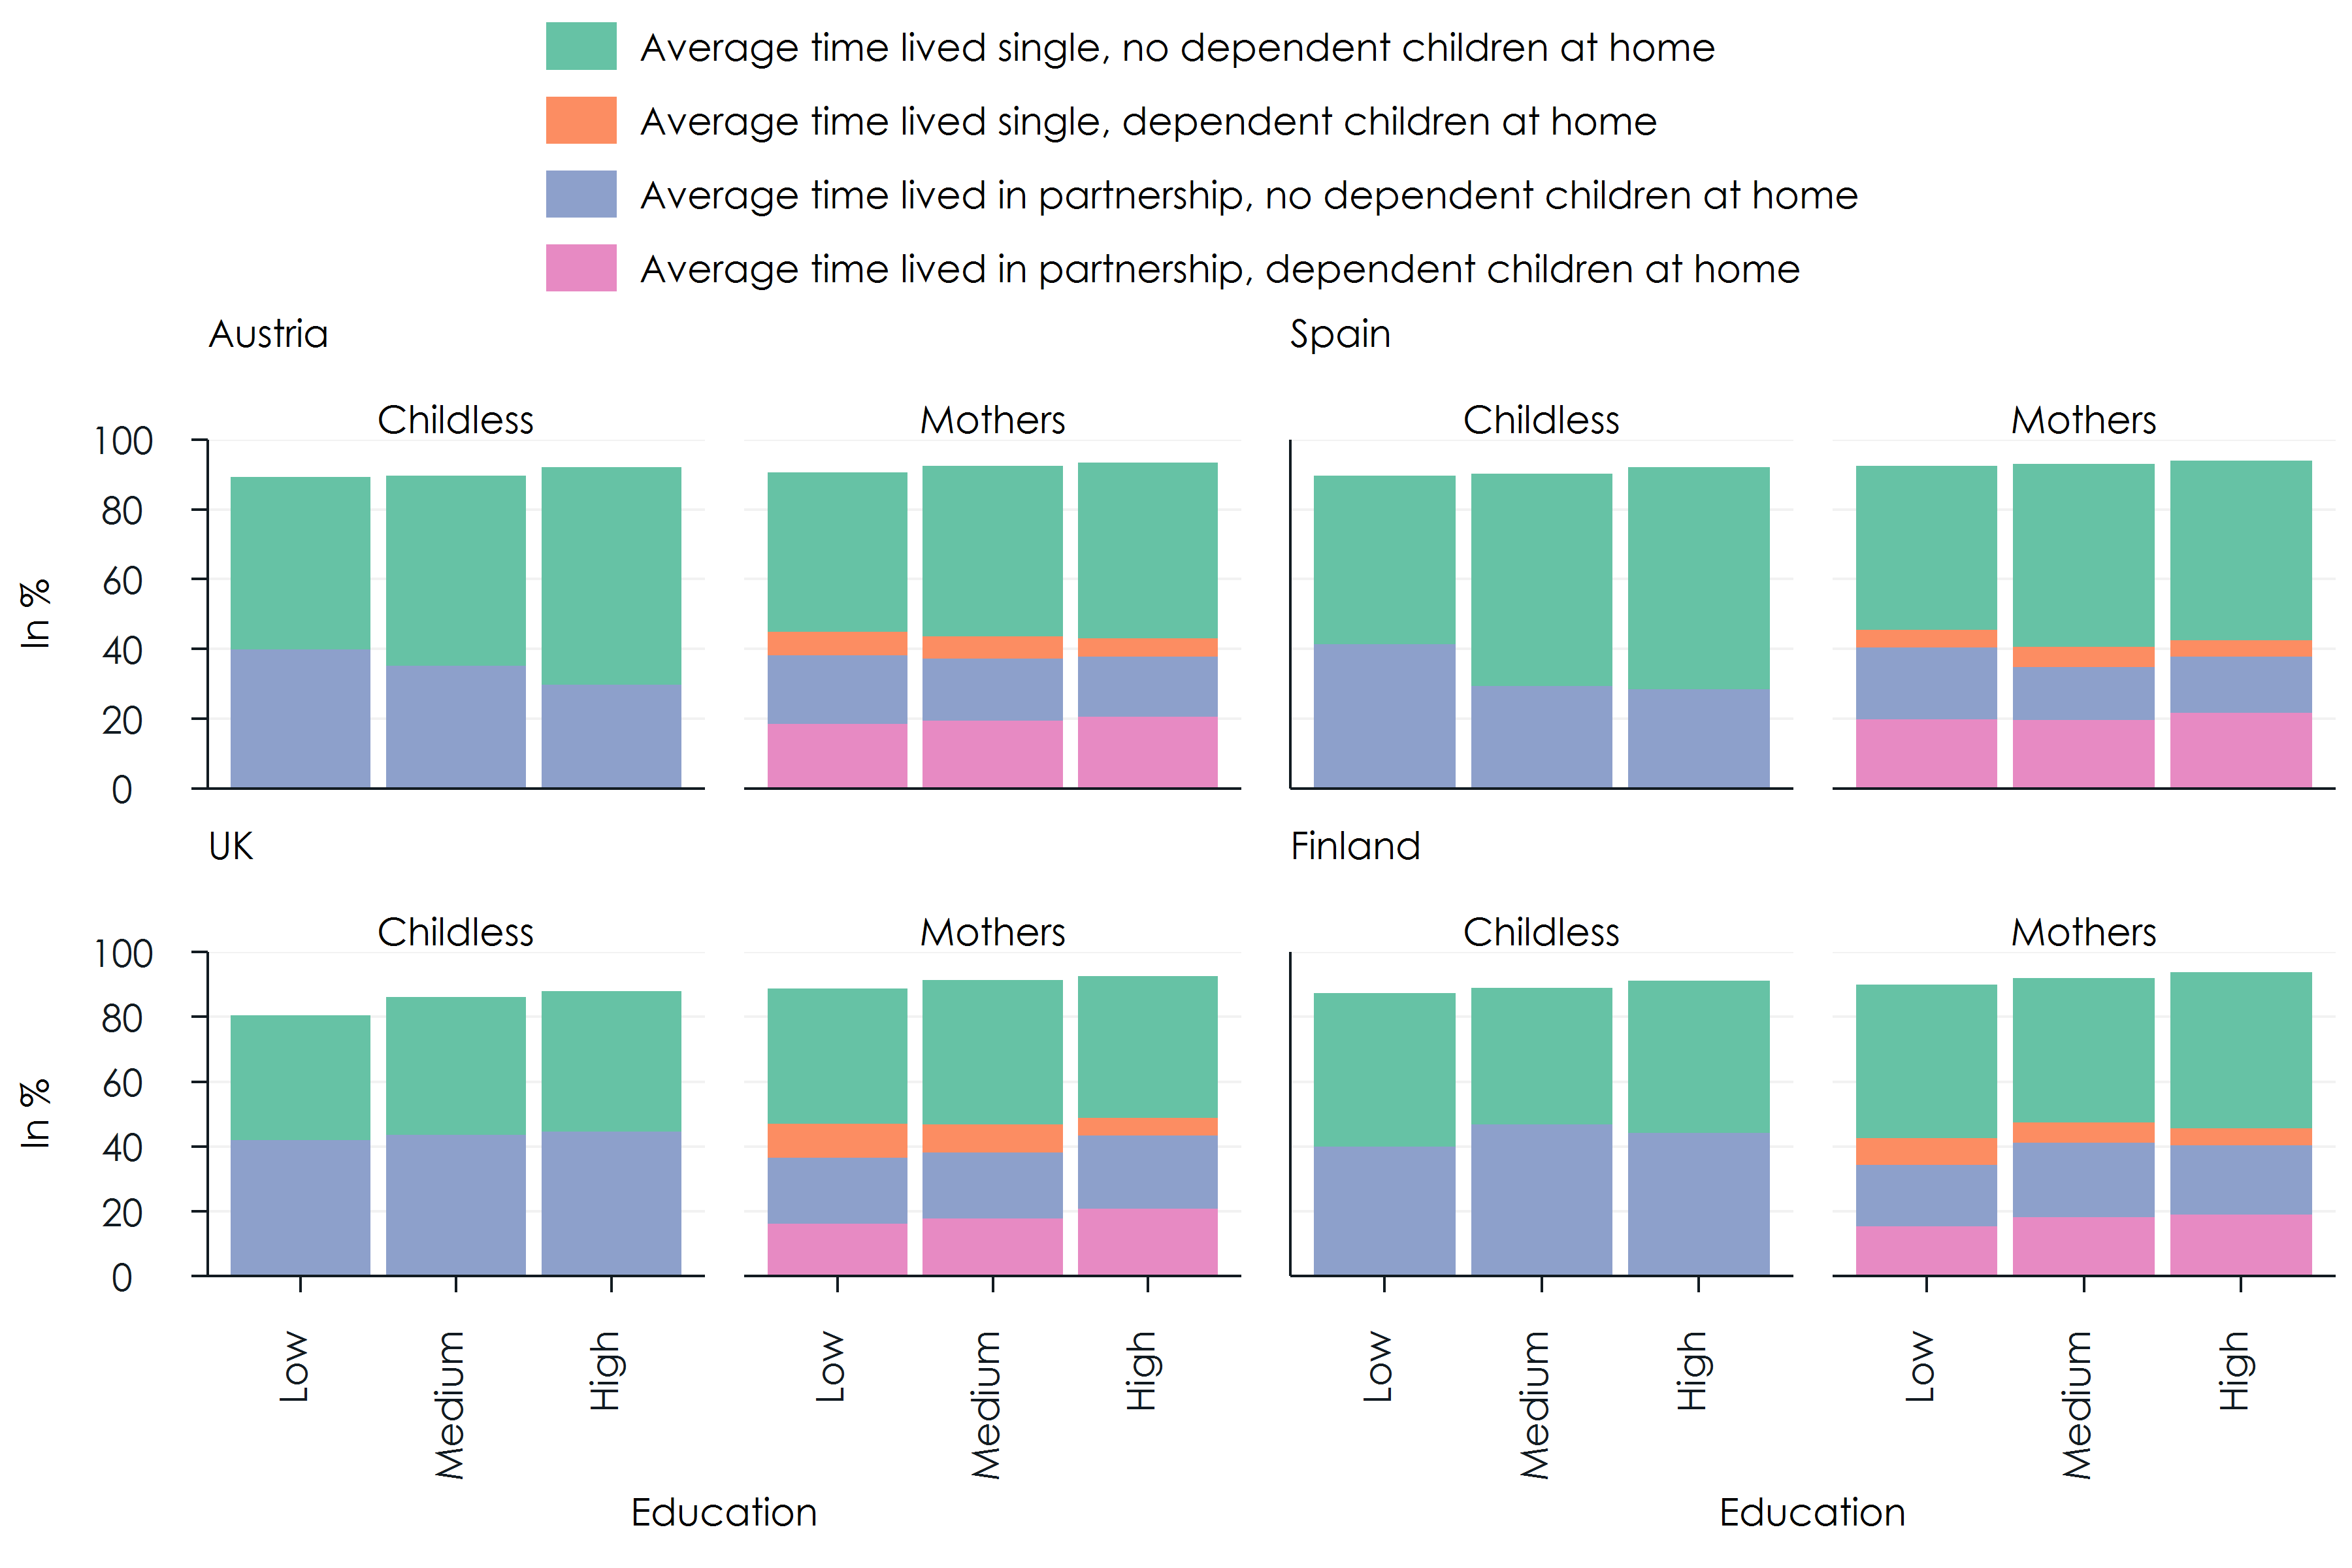
Source: Simulation results.
Partnership Parameters

Female partnership status
-  The probability of living in a partnership of women not living
   with dependent children by age and education
-  The probability of living in a partnership of women living with
   dependent children by age group, education, and age group of the
   youngest child.
Partner matching
-  Distribution of the partner's education by the education of
   the female partner
-  Distribution of the partner's age by the age of the female partner
Family linkages and leaving Home
One process accompanying the transition to adulthood is moving out of the parental home. Across Europe, there are considerable differences in age when young adults leave their parental home. In southern European countries, young adults on average stay at home until about 30. In contrast, in northern European countries, moving out of the parental home on average takes place ten years earlier in life. The four countries considered - Spain, Austria, Finland and the UK – cover the entire spectrum. The latest figures from Eurostat show that within the European Union the average age is about 26 years. Austria with 25.4 and the UK with 24.6 years are close to this average, while in Finland, the average age at leaving home is 21.8.
Figure 11: Average age leaving home
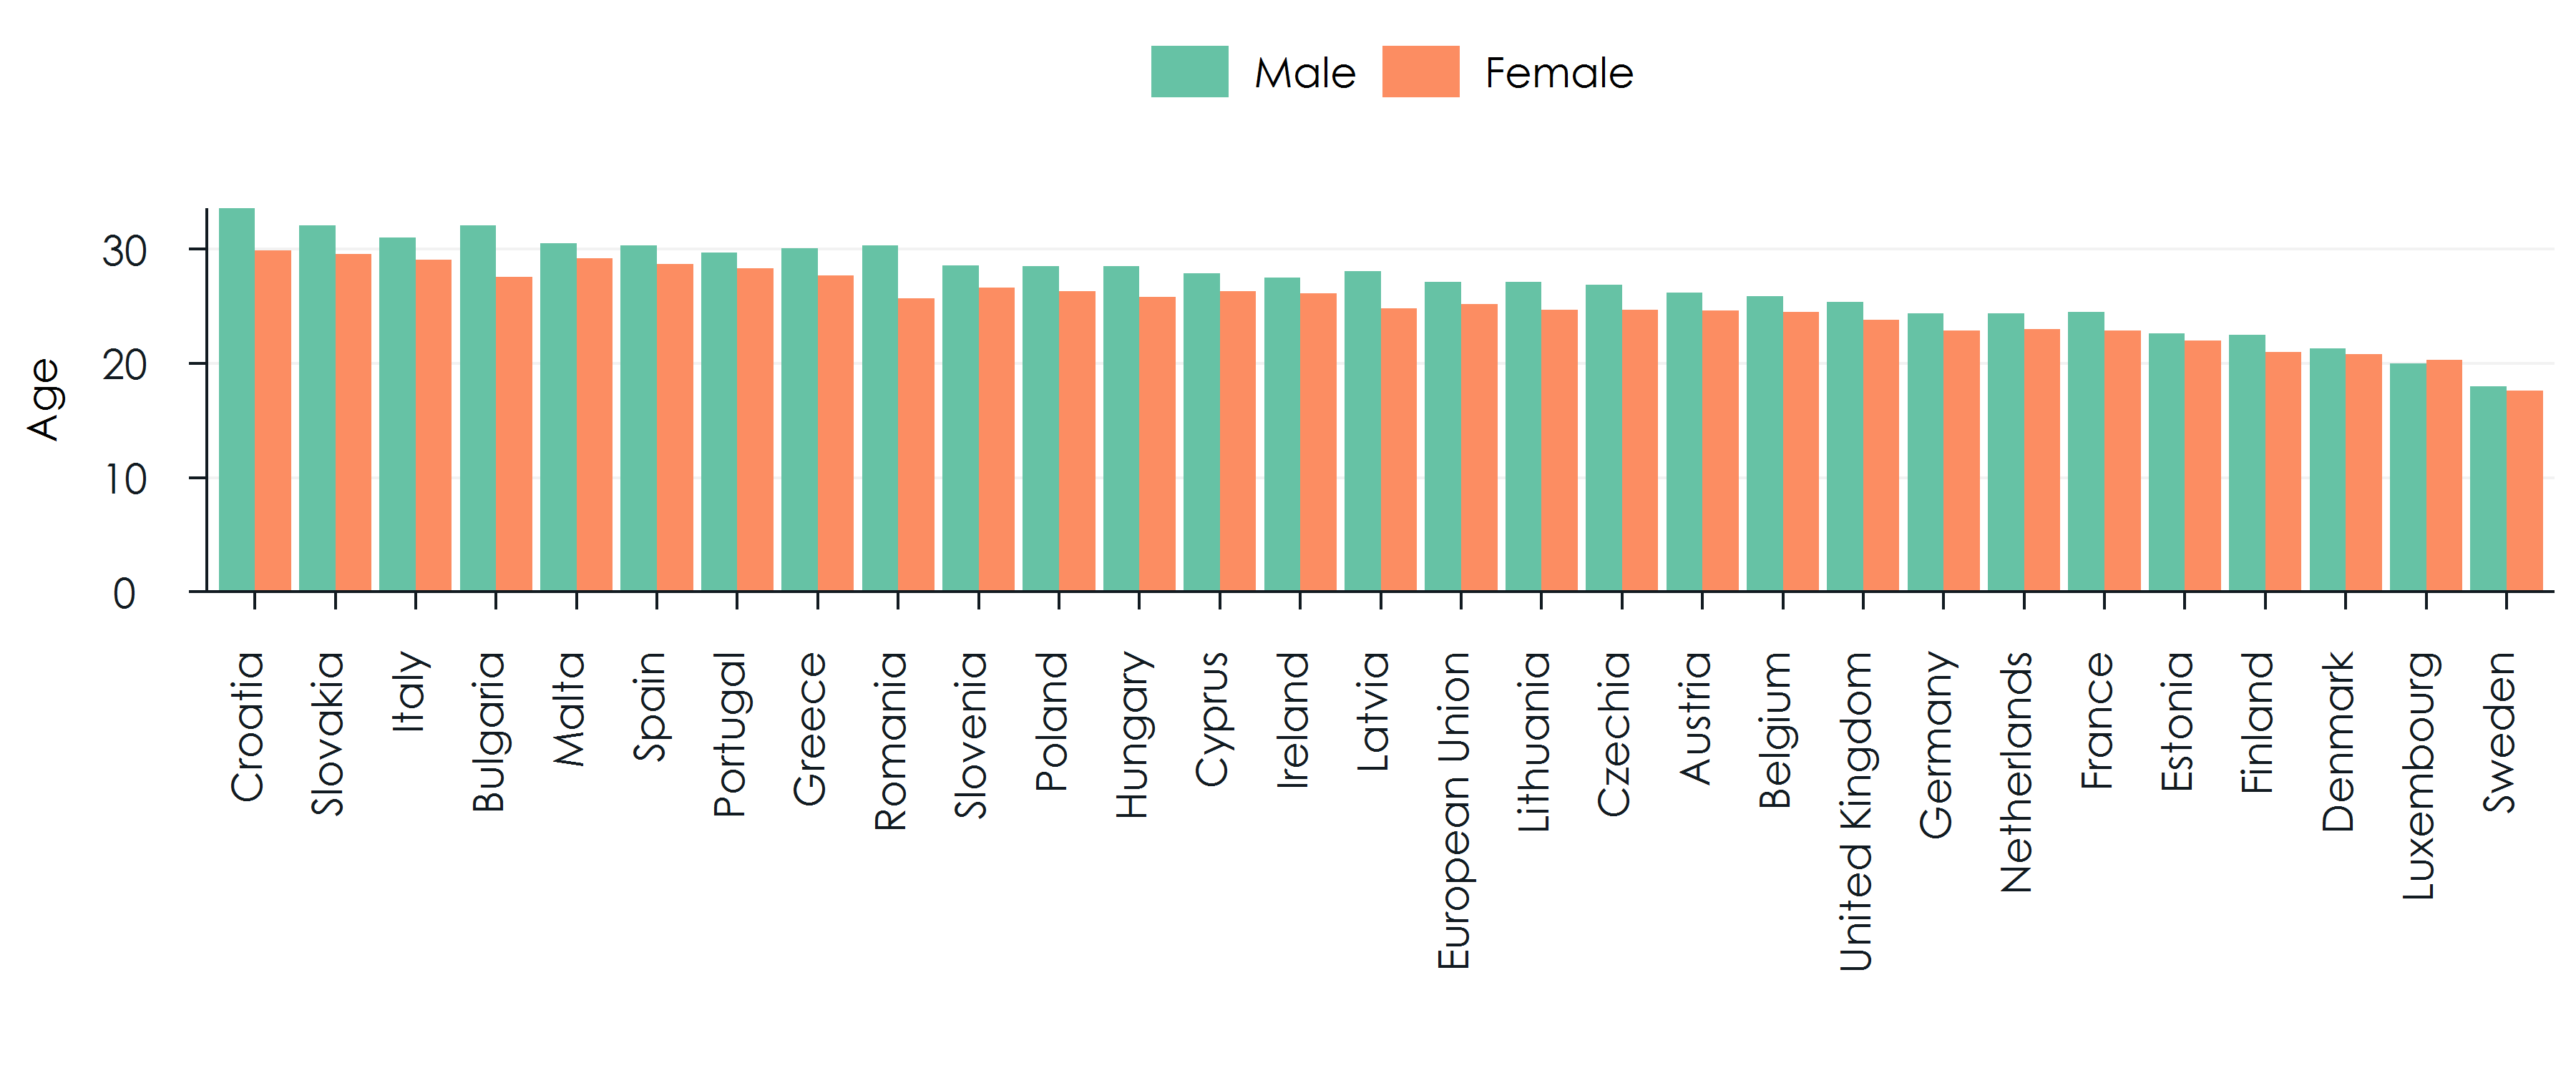
Source: Eurostat.
There is abundant literature on this topic, linking the differences to housing costs (Haurin et al., 1993; Ermisch and Di Salvo, 1997), cultural differences and social norms (Giuliano, 2007; Alesina and Giuliano, 2010), entrance in the labour market or marriage (Di Stefano, 2017). Several scholars also suggest that parental resources play an essential role, at which age children leave home (Avery et al., 1992).
Eurostat calculations of children living at home are based on household data. In contrast, microWELT models nuclear families. According to our definition, nuclear families consist of one or two adults and dependent children, if present in the household. As we do not simulate employment and income, we define dependency by age and school enrolment. Children reach independence at age 18 if not enrolled in education. Students staying with their parents are assumed to be dependent up to their 26th birthday. Birth and partnership events also lead to the creation of a new nuclear family. This definition is consistent with disaggregated NTA variables produced alongside the WELTRANSIM project.
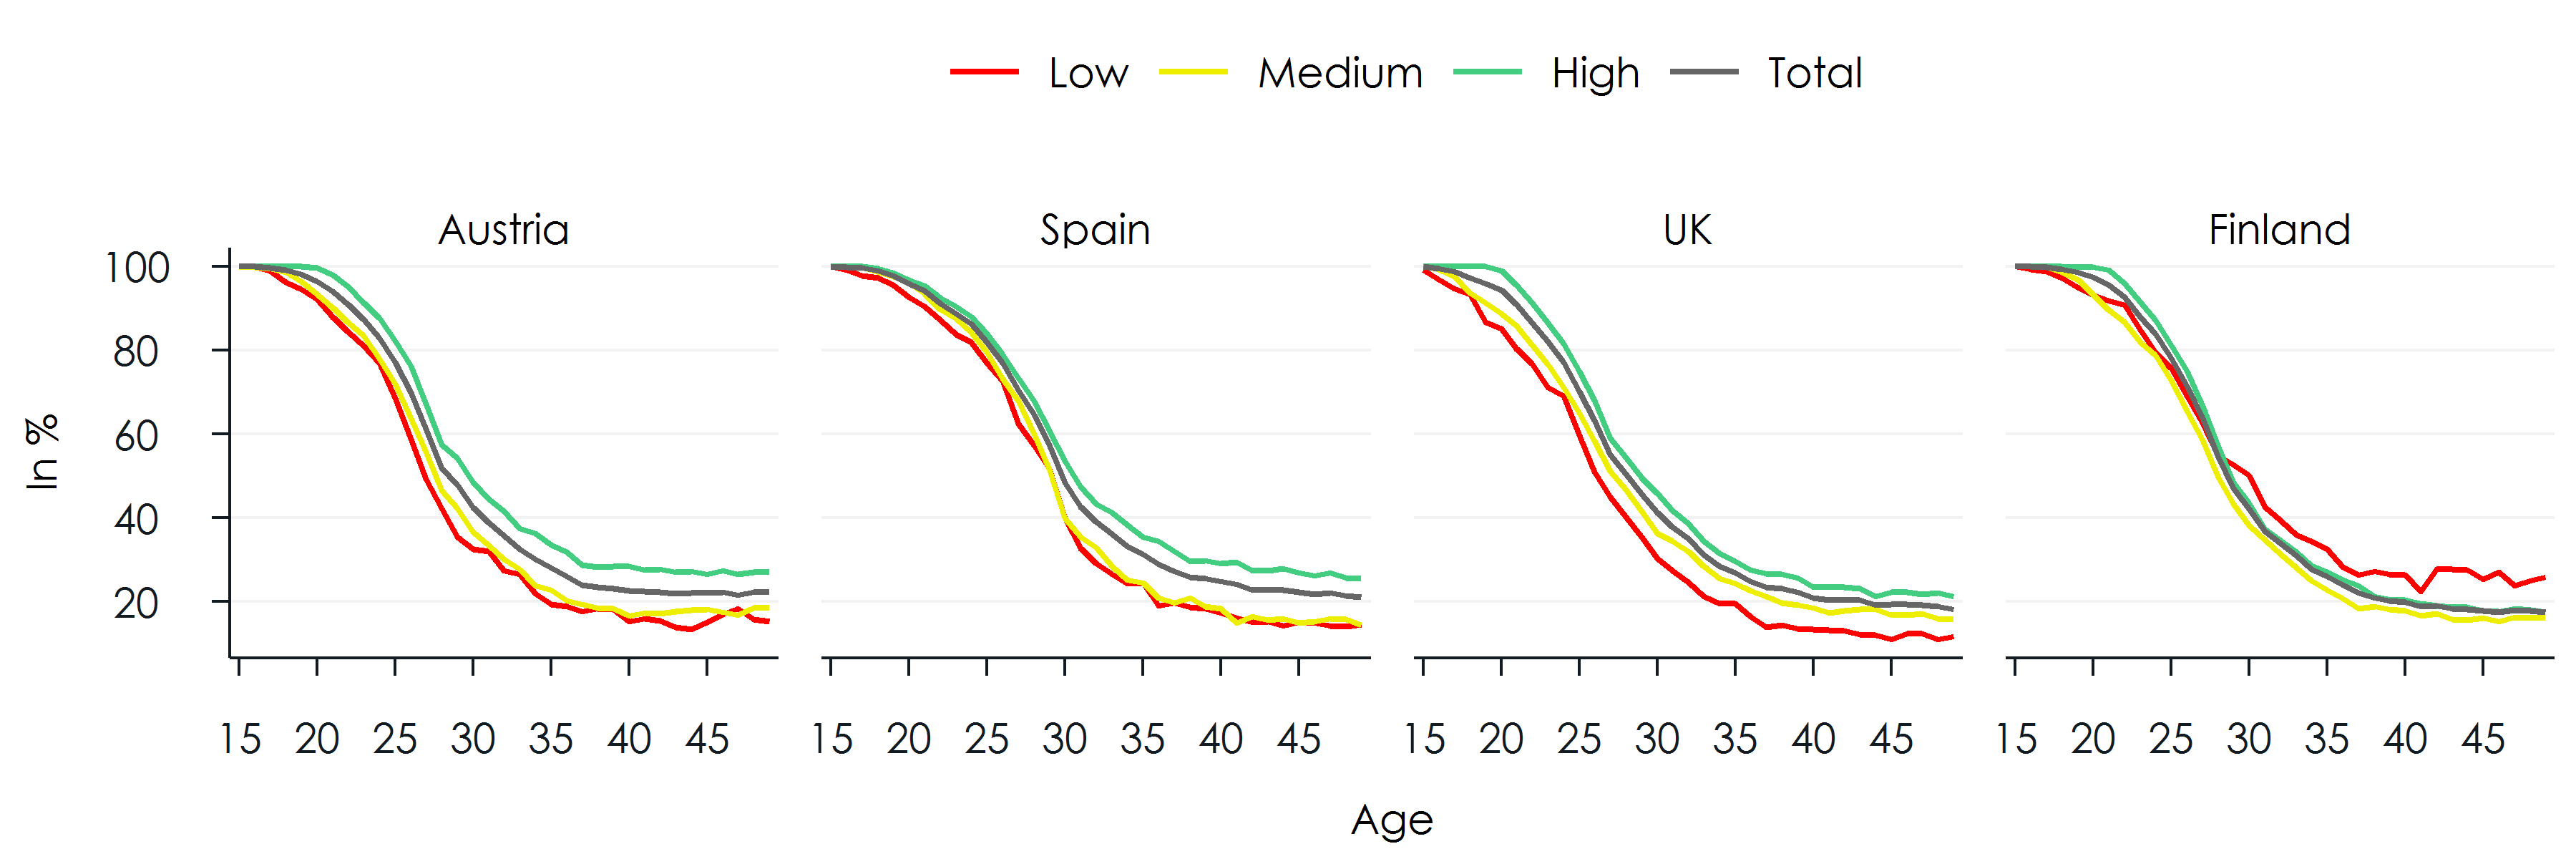
Figure 12: Proportion of students living with parents
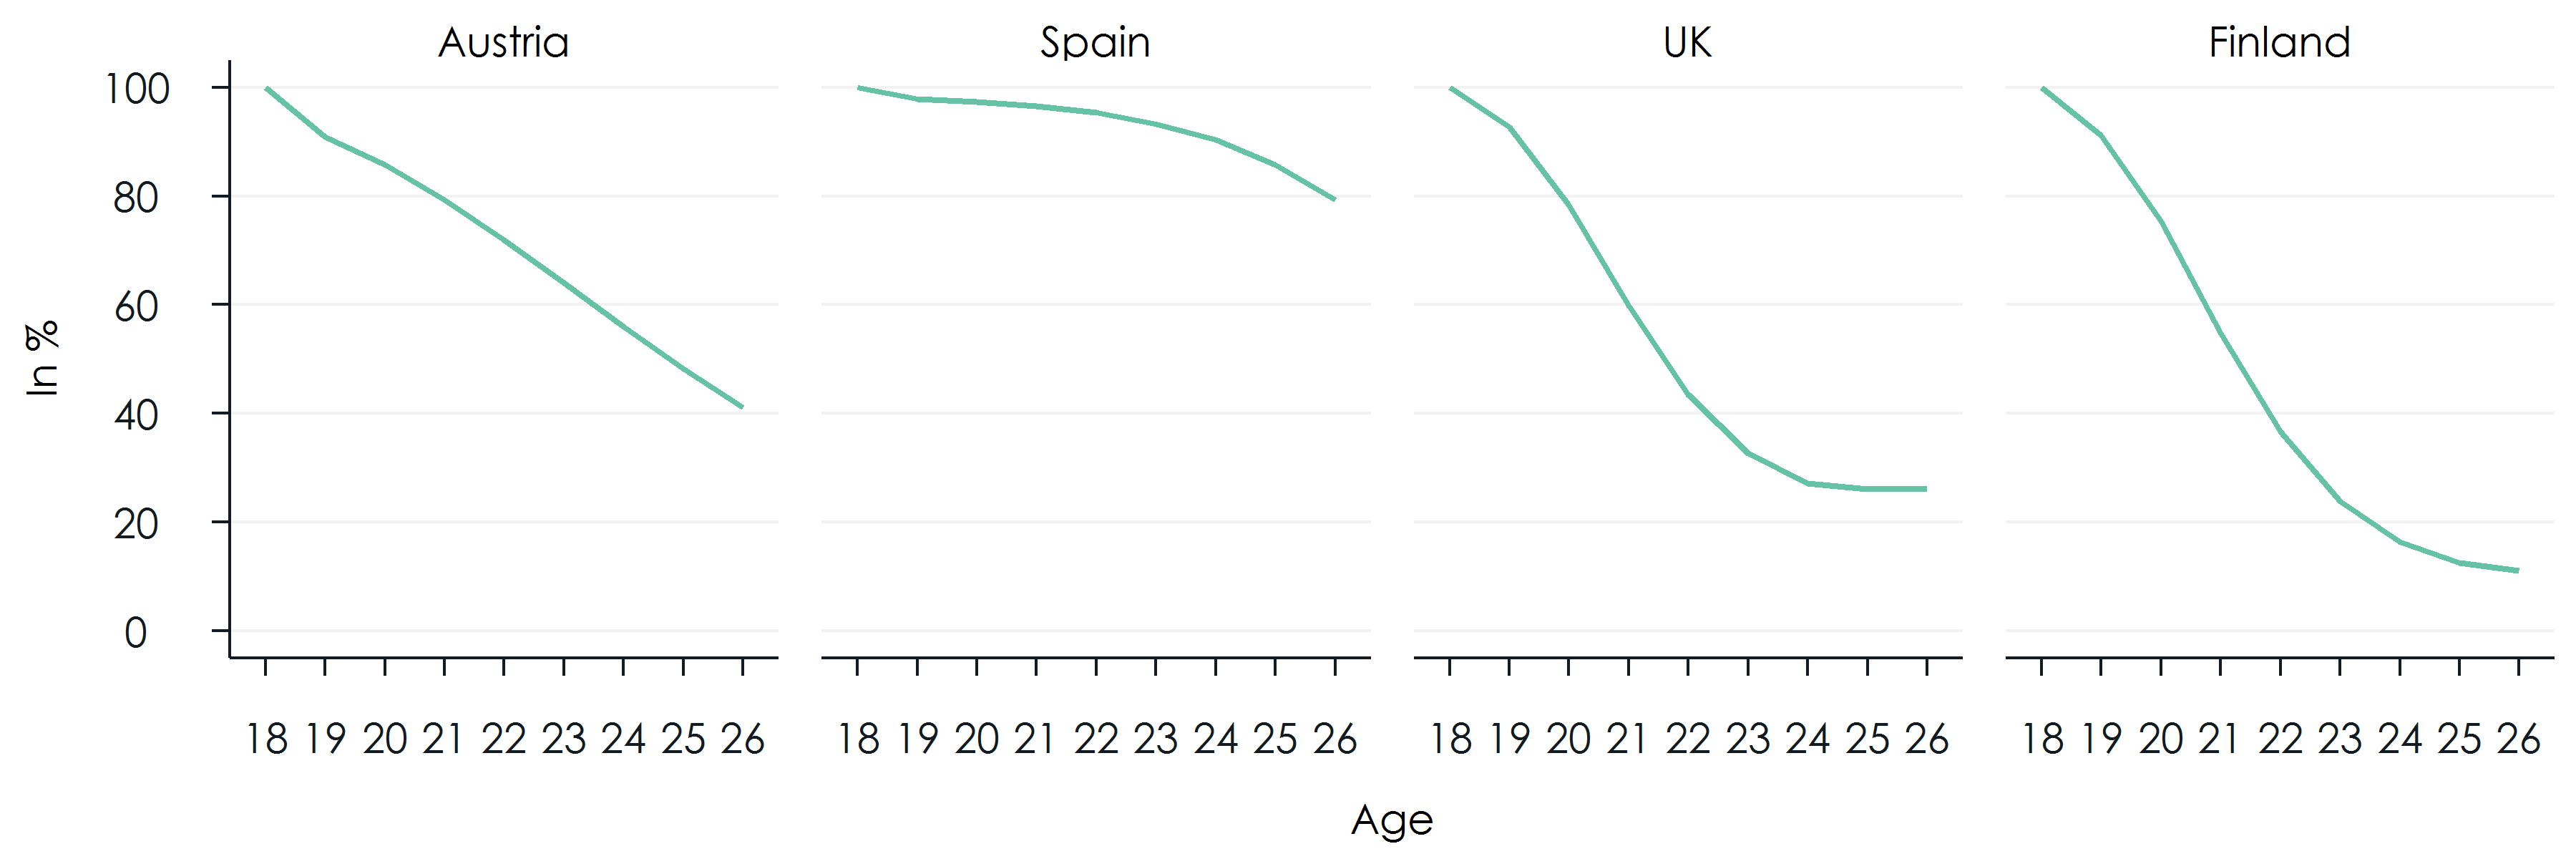
Source: Own estimations based on EUROMOD SILC.
The proportion of students living with parents depicted in Figure 12 shows the significant variation across countries as could be expected from the different ages of leaving home based on Eurostat estimates (Figure 11). Taking the 22nd birthday as a reference when a first high degree can typically be attained, at this point in life more than 96% of students still live with parents in Spain, compared with only 37% in Finland.
When leaving home, children form their own nuclear family. microWELT implements two types of links to parents. The first refers to biological parents and is established at birth. If a mother does not have a partner when giving birth but enters a partnership within the first year after giving birth, this partner is considered a biological parent as well. Links to biological parents are kept over the whole life and only dissolved due to death. The second type of child-parent links refers to social parents. In the case of union dissolution of parents, children choose with whom to stay and dissolve the other link. If the remaining parent enters a new partnership, a link to the new partner is established.
Family linkages and leaving home parameters

-  Probability of students leaving home by age
-  Probability of children to stay with the mother in the case
   of a union dissolution of parents
Socio-demographic Projections
As described in detail in Spielauer et al. (2020a), microWELT is being developed as a tool integrating dynamic microsimulation with the National Transfer Account (NTA) approach for the comparative analysis of the effect of demographic change on transfer flows in four welfare state regimes. NTA data are cross-sectional age profiles breaking down national accounting variables on consumption, income, saving, and transfers (United Nations, 2013). NTA data by sex are available for more than 50 countries, including most European countries (agenta-project.eu). Alongside the WELTRANSIM Project, we further disaggregated NTA data by education and family type (Abio et al. 2020). microWELT produces the required detailed socio-demographic projections for using these disaggregated NTA data. In particular, simulations cover the following key dimensions used for disaggregating NTAs:
- Age, sex
- Own education, education enrolment, and education of parents
- Partnership status, ever having had children versus childlessness, and current cohabitation with dependent children
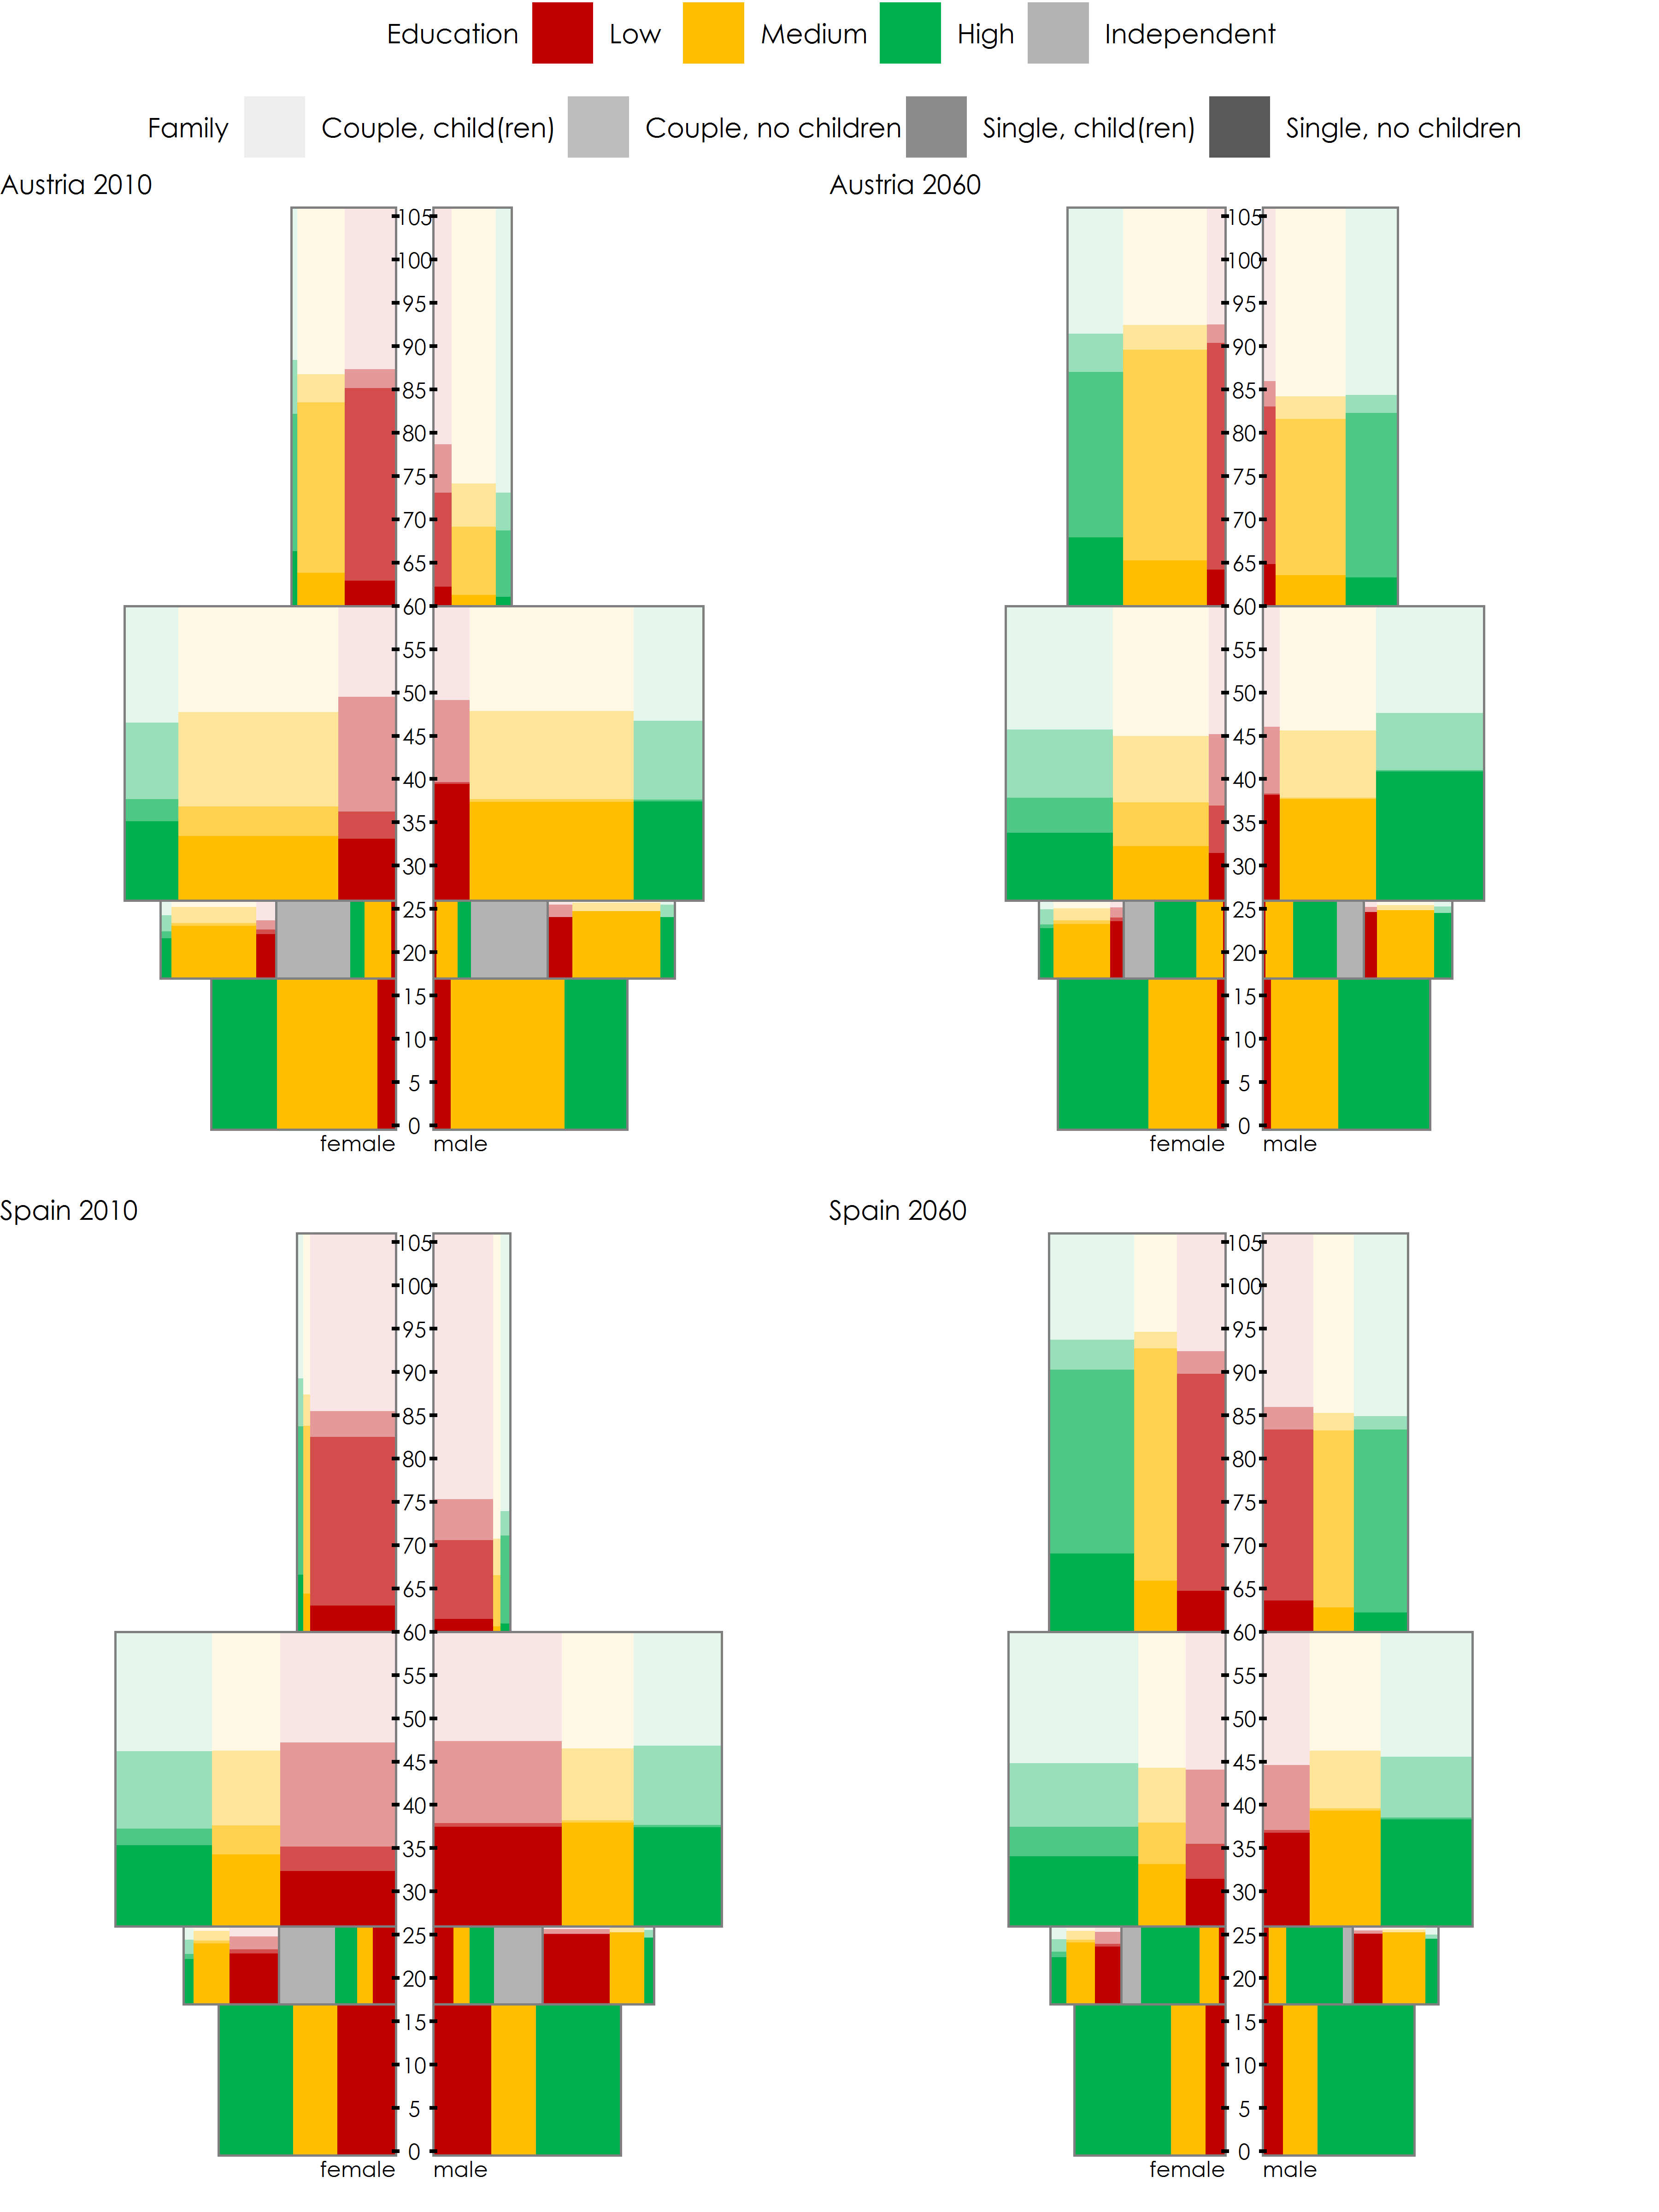
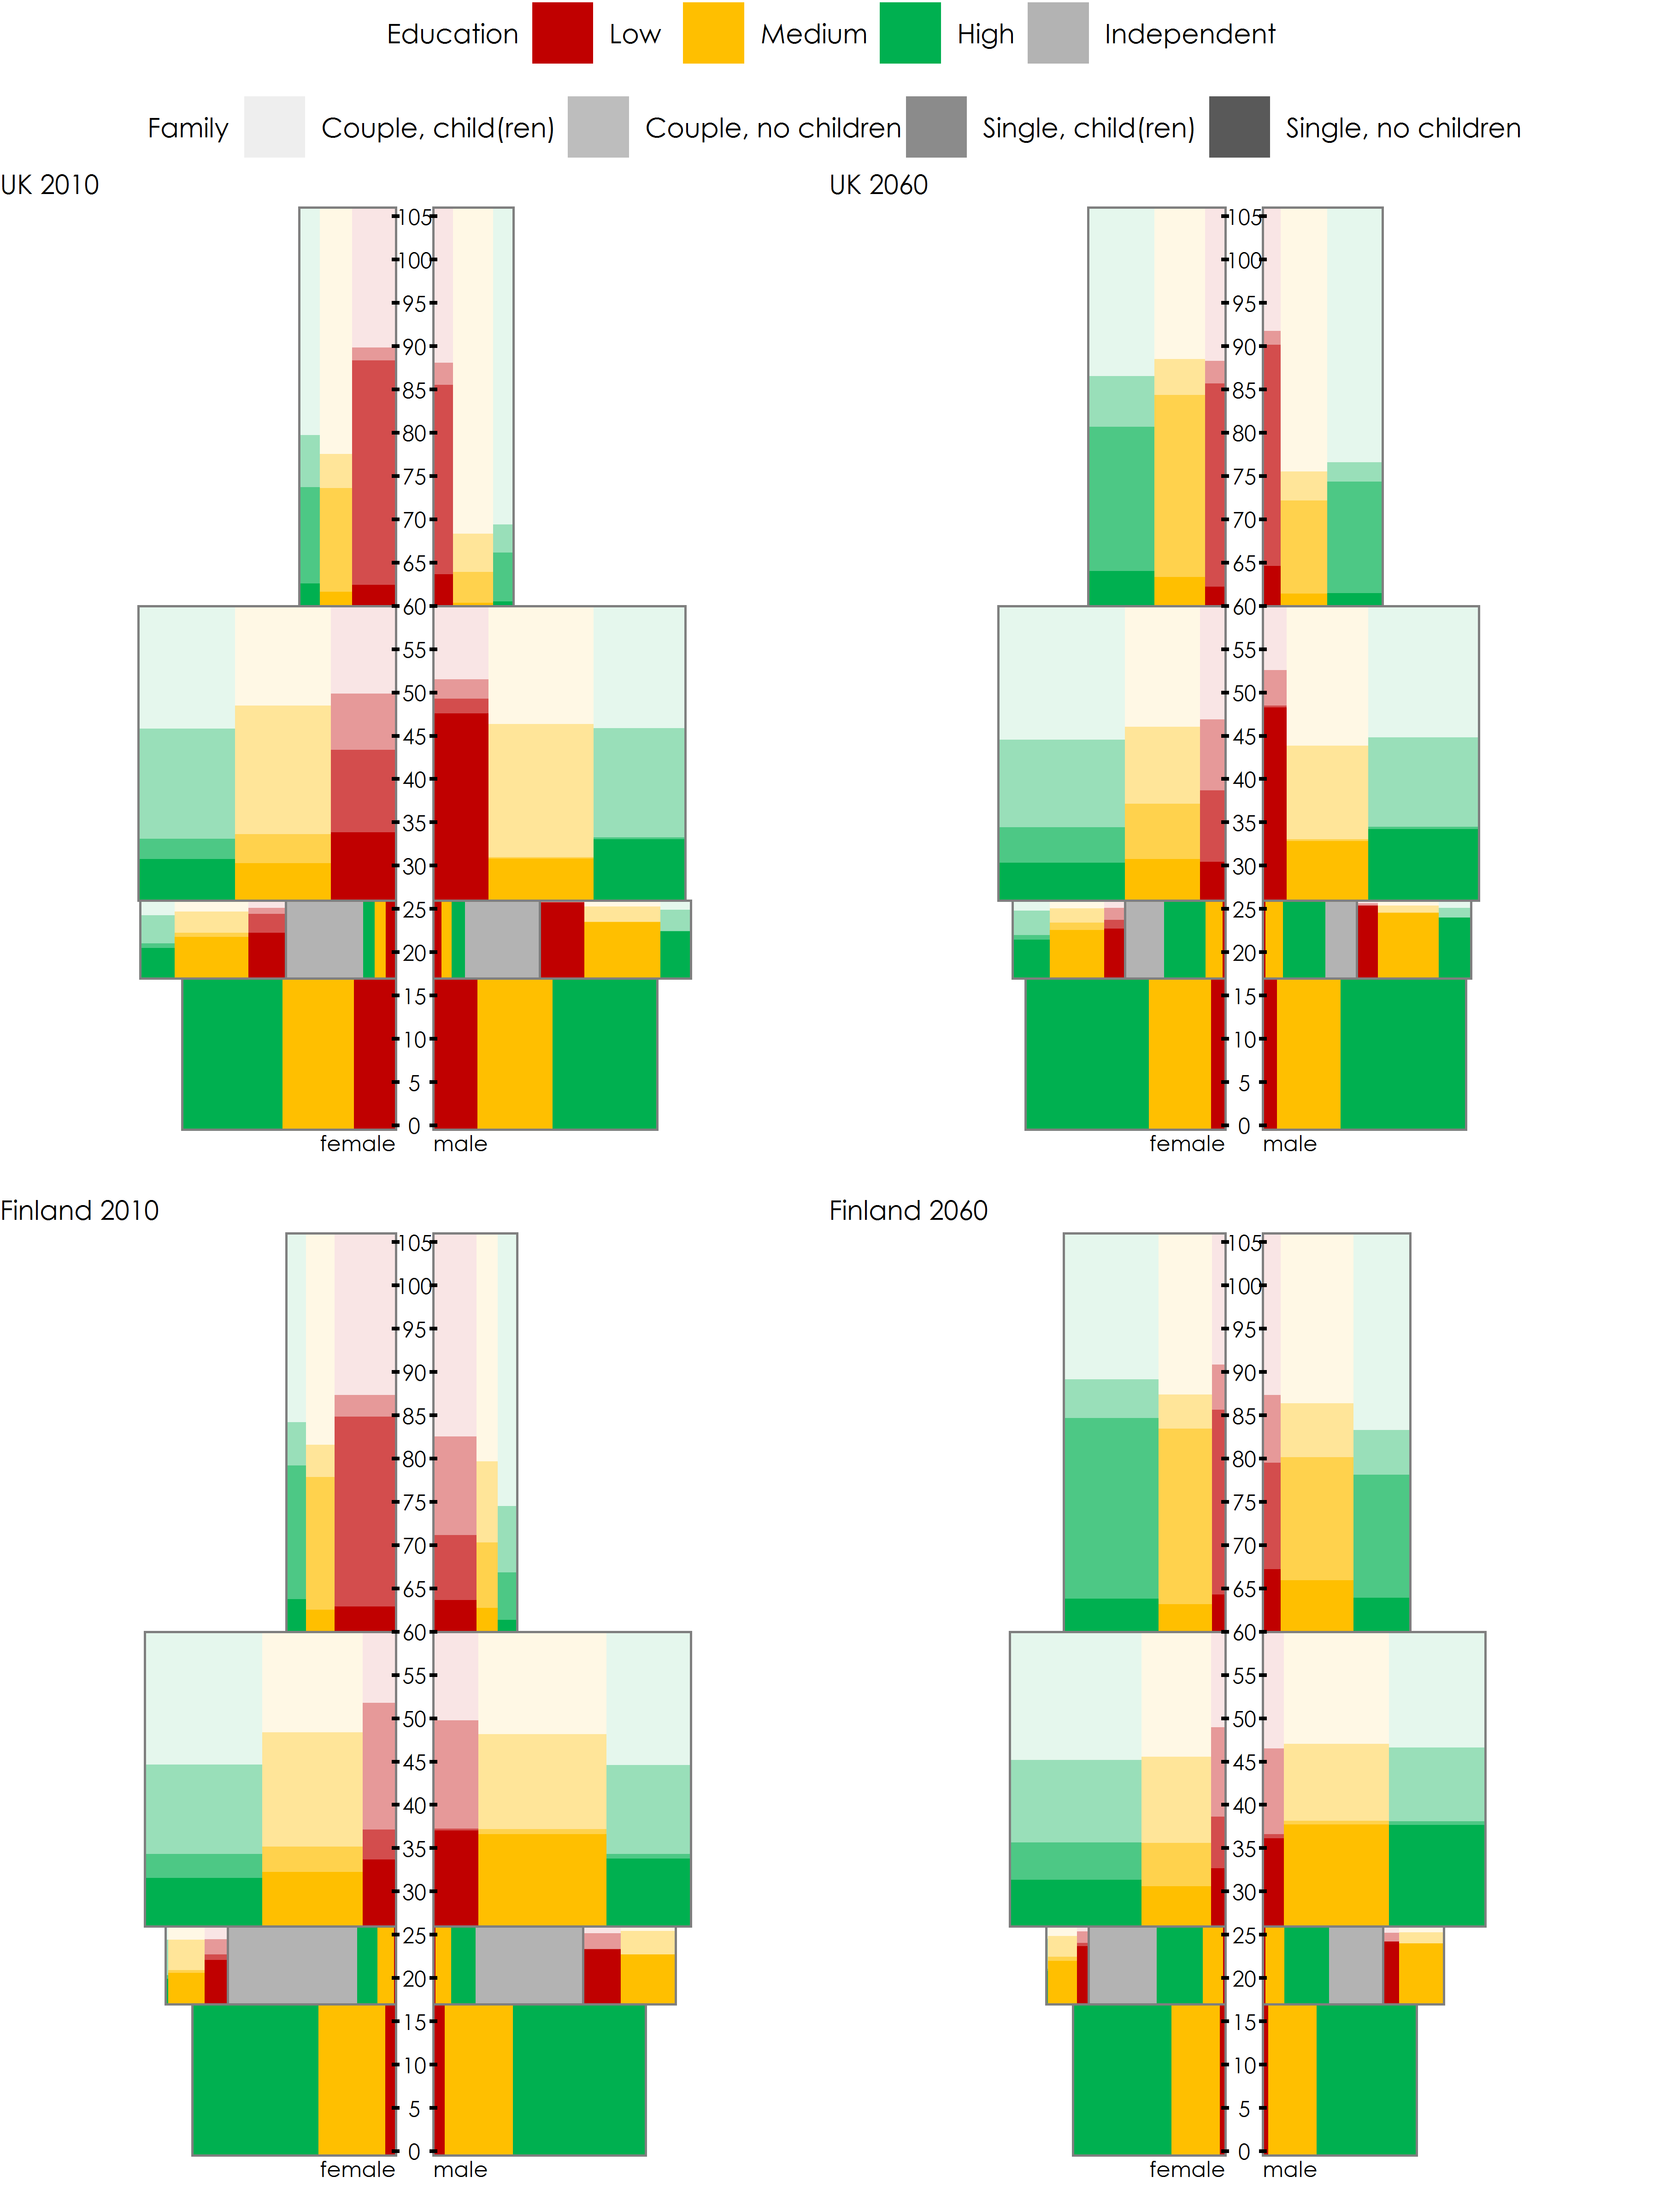
Figure 13 depicts the population compositions by sex, age, education and family type as observed at the start of the simulation in 2010 compared to microWELT projections for the year 2060. In order to synthesize these four dimensions into a single graph inspired by age pyramids, we collapse age to 4 age groups:
- Children 0-16 by sex and education of parents.
- Young adults 17-25 distinguished in students and non-students. Students are classified by parent’s education if living with their parents, or a group “independent” if having left home. Non-students are classified by their own education and by family type (like adults 26-59).
- Adults 26-59 are classified by education and family type. Family types are singles not living with dependent children, singles living with dependent children, couples not living with dependent children, and couples living with dependent children.
- For adults 60+, family types are defined differently as for younger age groups: we distinguish childless persons from persons ever having had children.
The surface of each square in Figure 13 represents the share of the respective group on the total population. For each age group (and sex), we horizontally divide the population into three education groups (red low, yellow medium, green high). The population within each education group is vertically divided into four family types.
These population composition graphs give a quick impression on the population dynamics of each country but also how countries differ concerning their age and education structure and how the population composition changes over time. Comparing the population composition graphs in 2010 and 2060 shows how population ageing affects the age structure of the population: while the size of the square of the oldest age-group increases in all countries, it decreases for the middle age group. At the same time, the red-coloured areas (low education) decrease within all age-groups while especially the green areas (high education) increase markedly, showing the consequences of education expansion of the population. When comparing the population graphs, e.g. of Austria and Spain in 2010, we also get an impression of how the education composition of the population differs between these countries.
Figure 13: Population composition by age group, education and family type 2010 and 2060
Outlook and Conclusions
With this paper, we followed two objectives. First, we provided an overview of the socio-demographic core modules of microWELT model. Second, we described essential characteristics and processes driving the socio-demographic changes we capture with the model. microWELT is being developed for the comparative analysis of four welfare state regimes represented by Austria, Finland, the UK, and Spain. We found considerable differences in the socio-demographic characteristics and trends of the four countries.
This paper is part of a series of related papers and other resources which together build comprehensive documentation and presentation of the research performed developing and using microWELT. All materials are available at the project website www.microWELT.eu. One of the objectives of microWELT is the provision of a modelling platform available for applications beyond the WELTRANSIM project. A collection of project descriptions and links to these projects is provided on the project website. microWELT is an open-source project: the application, the model code, a step-by-step implementation guide as well as analysis scripts for parameter generation are available for download.
Appendix
The proportion of mothers living in a partnership by age group, education and the age of the youngest dependent child
In Table A 1, we assess country-specific differences in partnership status by logistic regression models for each country in our sample. For all countries, we find that the proportion of mothers living in a partnership decreases with the age of the youngest child. We also find that the probability of living in a partnership increases with the age of mothers. Higher educated mothers are more likely to live in a partnership as compared to mothers with low education, especially in Finland and the UK.
Table A 1: Proportion of mothers living in a partnership, logistic regression, Odds Ratio reported
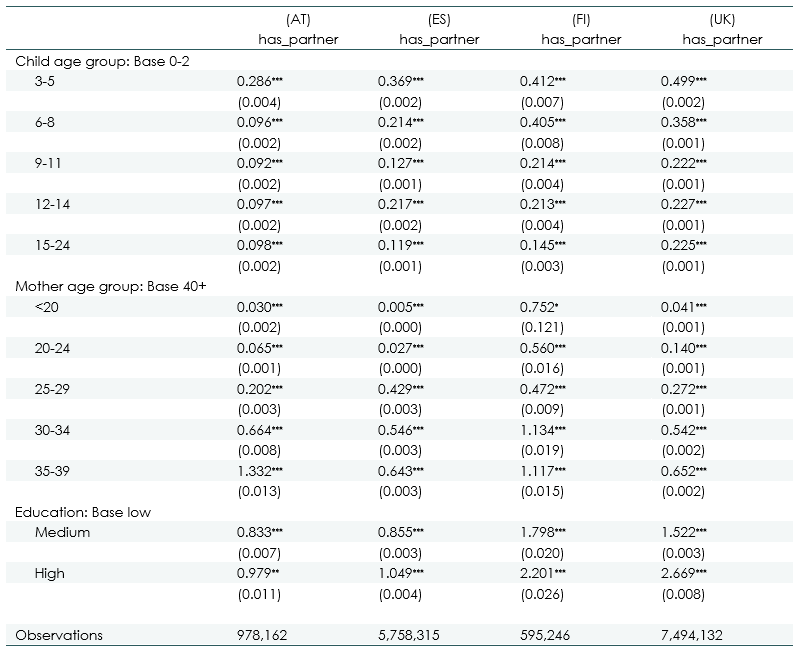
Source: Own calculations based on 2010 EUROMOD data. Exponentiated coefficients; Robust standard errors in parentheses; frequency weights applied * p < 0.1, ** p < 0.05, *** p < 0.01.
In what follows, we test whether there are statistically significant country-specific differences in partnership status of mothers and how their partnership status varies by mothers age and the age of the youngest child in the family. In the following regressions we apply probability weights. Point estimates are almost the same compared to frequency weights. Yet frequency weights due to the generation of a large sample - yield very tiny p-values.
In all tables, we present results from logistic regression models based on 2010 EUROMOD data. In Table A 2 we depict a simple model where we regress the likelihood of living in a partnership on the country dummies. The base category is the UK. As the table shows, compared to the UK, mothers are more likely living in a partnership in all the other three countries, a result that proves statistically highly significant.
Table A 2: Proportion of mothers living in a partnership, logistic regression, Odds Ratio reported
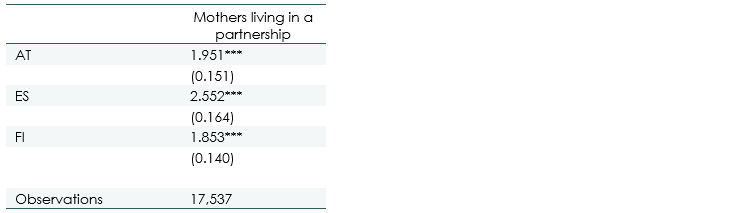
Source: Own calculations based on 2010 EUROMOD data. Exponentiated coefficients; Robust standard errors in parentheses * p < 0.1, ** p < 0.05, *** p < 0.01.
In Table A 3 we depict age differences of lone motherhood by regressing the likelihood of mothers living in a partnership on their age interacted with country dummies. In the UK, young mothers are less likely to live in a partnership than mothers aged 40 and older, our base category (which can be seen by the highly significant mother age group effects in the table). On the other hand, we do not find any significant age differences for Austria, except for women in the age of 35-39, who are more likely to be in a partnership compared to their UK counterpart. In Spain, we only find a significant negative age effect compared to the UK for women aged 20-24. In comparison, we find that all interaction coefficients are highly significant, and odds ratios are larger than one for mothers from Finland.
Table A 3: Proportion of mothers living in a partnership, logistic regression, Odds Ratio reported
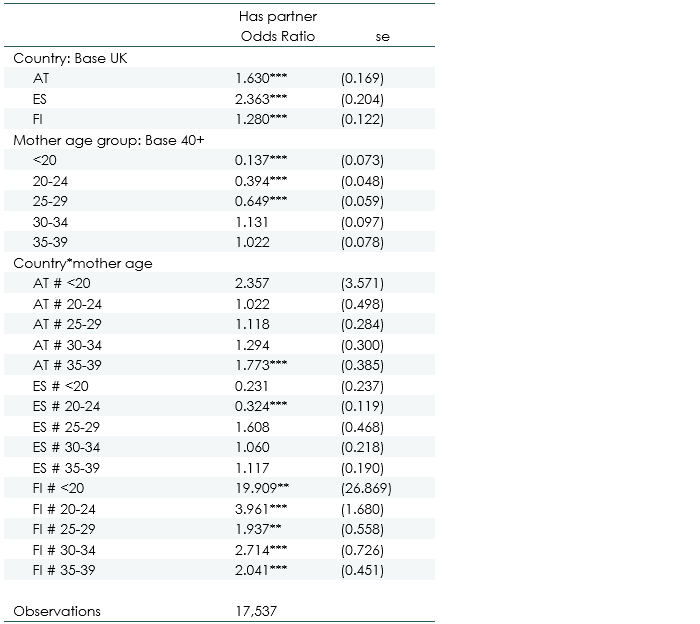
Source: Own calculations based on 2010 EUROMOD data. Exponentiated coefficients; Standard errors in parentheses * p < 0.1, ** p < 0.05, *** p < 0.01.
In Table A 4 we assess the potential correlation of partnership status and the age of the youngest child in the family by regressing the likelihood of living in a partnership on the age of the youngest child and interact this effect with the country dummies. The base country here is Finland, and the base age category of the youngest child is 0-2 years of age.
For Finland, we find that mothers are significantly less likely to be in a partnership the older the youngest child is. We do not find any significant different effect for Austrian mothers. However, for Spain and the UK, we find that compared to Finland, mothers are significantly more likely to live in a partnership the older the youngest child.
Table A 4: Proportion of mothers living in a partnership, logistic regression, Odds Ratio reported
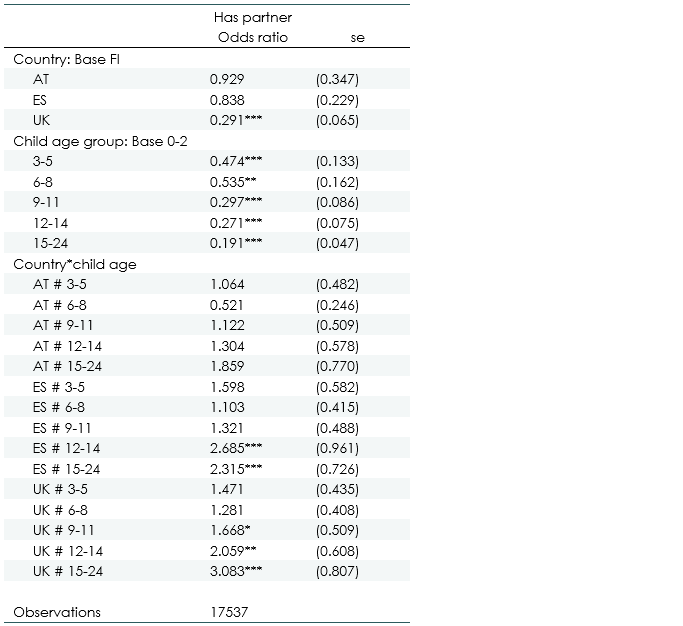
Source: Own calculations based on 2010 EUROMOD data. Exponentiated coefficients; Standard errors in parentheses, * p < 0.1, ** p < 0.05, *** p < 0.01.
Education progressions by parent’s education
In a next step, we test for country differences in education outcomes by parents’ highest level of education (i.e. differences in the intergenerational transmission of education) based on Eurostat’s 2009 ad-hoc module of the Labour Force Survey microdata. For analysing these potential country-specific differences, we construct two education dummies for a descendant’s highest level of education (“medium” corresponding to ISCED 3-4 or “high” corresponding to ISCED 5+).
In Table A 5 we estimate logistic regression models for the probability of having a medium (high) education level on parents’ highest level of education (again distinguishing between low, medium and high education). The country base category is Finland, and parents’ education base category is high.
For Finland, we find that a descendant (irrespective of gender) is less likely to achieve a medium education level when parents are highly educated but much more likely to achieve higher education themselves. While the latter effect can be observed for all countries in our sample, for Austria and Spain, descendants from parents with intermediate education also show statistically significantly higher probabilities to achieve intermediate education as their highest education level. These results confirm that intergenerational transmission of education is very pronounced in Austria, Spain and the UK while being markedly lower in Finland.
Table A 5: Probability of having a medium or high education level, logistic regression, Odds Ratio reported
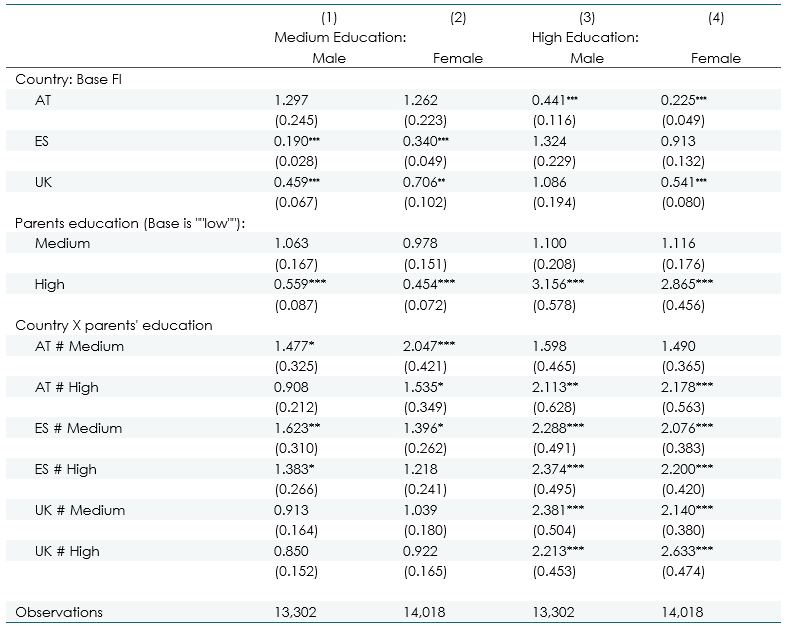
Source: Own calculations based on Eurostat 2009 ad-hoc module of the European Labour Force Survey. Exponentiated coefficients; Standard errors in parentheses * p < 0.1, ** p < 0.05, *** p < 0.01.
References
- Abio Roig, Gemma, Patxot, Concepció, Souto, Guadalupe, Istenič, Tanja
(2020), Disaggregated National Transfer Accounts by Education and Family
Types for Spain, UK, Austria, and Finland. (Tentative title) University of
Barcelona, forthcoming. The paper will be made available on the project
website www.weltransim.eu
- Alesina, Alberto; Giuliano, Paola. (2010). The power of the family, Journal
of Economic Growth, 15, 93-125.
- Avery, Roger; Goldscheider, Frances Kobrin and Speare, Alden Jr. (1992).
Feathered Nest/Gilded Cage: Parental Income and Leaving Home in the
Transition to Adulthood”, Demography, 29(3): 375-388.
- Berrington, A., Stone, J., Beaujouan, E., 2015, Educational differences in
timing and quantum of childbearing in Britain: A study of cohorts born
1940−1969, Demographic Research, Vol. 33, Article 26, 733-764
- Di Stefano, Enrica (2017). Leaving your mamma: Why so late in Italy? Temi
Nr. 1144, Bank of Italy.
- Ermisch John, Di Salvo Pamela. (1997) The economic determinants of young
people’s household formation, Economica, 64(256): 627–644.
- Giuliano, Paola (2007). Living Arrangements in Western Europe: Does Cultural
Origin Matter? Journal of the European Economic Association, 5(5), 927-952.
- Haurin Donald; Hendershott Patric; Kim Dongwook (1993) The impact of real
rents and wages on household formation, The Review of Economics and
Statistics, 75, 2, 284–93.
- Klotz, J. (2007) Soziale Unterschiede in der Sterblichkeit.
Bildungsspezifische Sterbetafeln 2001/2002, Statistische Nachrichten, 2007,
(4).
- Leoni, Th., Spielauer, M., Reschenhofer, P., Soziale Unterschiede,
Lebens-erwartung und Gesundheits-ausgaben im Lebensverlauf,
WIFO-Monographien, Mai 2020.
- Murtin, F., Mackenbach, J., Jasilionis, D., Mira d’Ercole, M., (2017),
“Inequalities in longevity by education in OECD countries: Insights from new
OECD estimates”, OECD Statistics Working Papers, No. 2017/02, OECD
Publishing, Paris, pdf.
- OECD (2018), A Broken Social Elevator? How to Promote Social Mobility, OECD
Publishing, Paris, pdf.
- Requena, Miguel (2017) La desigualdad ante la muerte: educación y esperanza
de vida en España. Perspectives Demogràfiques Nr. 06. pdf
- Rotkirch A., Miettinen A. (2017) Childlessness in Finland. In: Kreyenfeld
M., Konietzka D. (eds) Childlessness in Europe: Contexts, Causes, and
Consequences. Demographic Research Monographs (A series of the Max Planck
Institute for Demographic Research). Springer, Cham.
pdf
- Shkolnikov, V.M., EM Andreev, R. Houle and J.W. Vaupel (2004) The
concentration of reproduction in cohorts of US and European women. Max
Planck Institute for Demographic Research, Rostock 2004 (MPIDR working
paper; WP-2004-027). pdf.
- Spielauer, M. (2005) Concentration of reproduction in Austria: general
trends and differentials by educational attainment and urban-rural setting.
In: Vienna Yearbook of population research 2005, Austrian Academy of
Sciences,
- Spielauer, Martin, Thomas Horvath, Marian Fink (2020) microWELT: A Dynamic
Microsimulation Model for the Study of Welfare Transfer Flows in Ageing
Societies from a Comparative Welfare State Perspective - WIFO Working
Papers, 2020, (609) pdf
- Sutherland, Holly, Figari, Francesco. (2013), “EUROMOD: The European Union tax-benefit mi-crosimulation model”. In: International Journal of Microsimulation. 6. 4-26. 10.34196/ijm.00075. pdf [retrieved 2020-09-17]