Chapter 4: Indicators
This chapter is organized as a self-contained paper
Spielauer, Martin, Thomas Horvath, Marian Fink, Gemma Abio, Guadalupe Souto, Ció Patxot and Tanja Istenič (2020) microWELT - Microsimulation Projection of Indicators of the Economic Effects of Population Ageing Based on Disaggregated National Transfer Accounts (NTAs) pdf
Abstract
This chapter studies how changes in the population composition by education and family characteristics impact on indicators of the economic effects of population ageing based on National Transfer Accounts (NTAs). NTAs constitute cross-sectional per-capita age-profiles of the key variables of national accounts consumption, income, saving, and public transfers, incorporating an estimation of private transfers. A variety of indicators based on NTA data combined with population projections was developed in the literature, of which we have selected two for our analysis: The Support Ratio (SR) and the Impact Index (IMP). We complement existing projections by using new disaggregated NTA data by education and family type, contrasting the results to the same indicators based on NTAs by age. Our projection analysis is performed using the dynamic microsimulation model microWELT. The model provides the required detailed socio-demographic projections and incorporates the NTA accounting framework. Our results show that indicators based on disaggregated data can give a very distinct picture of the economic effects of population ageing, as the burden of ageing is alleviated by the education expansion. Our study compares results for Austria and Spain.
Introduction
Population ageing affects the proportion between the active and the economically dependent population. Besides decreasing fertility and mortality, the post-war baby boom and the subsequent baby bust created a kind of demographic cycle that enlarged the otherwise gradual ageing process. The effect of baby-boomers reaching retirement age is further aggravated by declining mortality. On the other hand, education improvements and the increasing labour force integration of women, as well as health improvements and policy reforms leading to an increase in retirement age, can potentially mitigate this effect. In other words, demographic measures, such as the purely age-based dependency ratio (the population considered being in dependent age divided by the population in working age where working age is set to, e.g. 18-64) might not adequately capture the burden of population ageing on the economy. Specifically, the dependency ratio is insensitive to the age-profiles of income, consumption, and transfers. This effect is addressed by indicators based on National Transfer Accounts (NTAs) which break down national accounts by age.
The most widely used indicator based on the NTA approach is the economic Support Ratio (SR) measuring the changing relation between effective producers (or effective labour) to effective consumers, the term effective referring to the age shape of labour input and consumption used as weighting factors. It builds on the older Support Ratio, which in its simplest form – as a purely demographic measure such as the dependency ratio – relates the working-age population (e.g. 18-64) to the total population. Suggestions to apply weights to more adequately represent producers and consumers – e.g. by accounting for labour force participation – were first suggested by Cutler et al. (1990). For further discussions on the definition of support ratios see Mason and Lee (2006), Patxot et al. (2011) and Prskawetz & Sambt (2014). The economic Support Ratio (in the following NTA SR) gives a more comprehensive measure in this line by replacing the size of the working-age population by the population, weighted by the age profile of the current average labour income. Similarly, the total population size is replaced by the population, weighted by the age profile of current consumption. Projections of the Support Ratio are available for many countries. When the Support Ratio increases, economies experience the so-called “demographic dividend” (a relative increase of the working-age population with respect to the dependent population). The demographic dividend is still positive in many developing countries, which are at early stages of their demographic transition; It is exhausting in Europe as more baby boomers enter into retirement. The evolution in Europe is estimated in Prskawetz & Sambt (2014) using NTA data built in the AGENTA project.
As said above, education expansion is one of the sources that might mitigate the impact of ageing. Mejía-Guevara et al. (2016) propose a decomposition of the demographic dividend into age and education effects using NTA age profiles by educational attainment. Their results confirm that the education component partly offsets the future negative effect of ageing on the Support Ratio.
NTA data opens another window of opportunity to improve future projections by offering a measure of family transfers and their complementary role in the economy. Projections usually ignore the fact that the demographic transition is, to a great extent, a gender transition, accompanied by a change in family structures as females incorporate into the labour market. (Doepke, and Tertilt (2016) stress the need to integrate changes in family structure in dynamic macroeconomic models, summarising attempts made to do so both in the short run and in the long run in growth models.) In other words, the Support Ratio, while providing a less mechanic indicator of the effects of population ageing than the demographic dependency ratio, ignores all improvements in human capital and changes in female labour force participation and hence family structure.
In this paper, we study how accounting for the changing education composition of the population and changes in family patterns affects the Support Ratio. This is possible due to newly developed NTA data by education and family type (Abio et al. 2020). While still being a cross-section measure ignoring all trends within the distinguished population groups, incorporating the education and family dimension adds some realism by accounting for critical composition effects. Higher educated people on average obtain a higher income, stay in the labour force longer, and – during active age – pay higher contributions; on the other side higher educated people on average live longer lives and receive higher pensions. We use the dynamic microWELT (Welfare Transfer) microsimulation model (Spielauer et al. 2020a/b) to project the Support Ratio and for assessing the individual contribution of the various processes such as education and familial change, improvements in mortality, as well as mortality differentials by education on this measure.
While the Support Ratio aims at providing an indicator of how the ratio of labour input and (age-weighted) consumption would be different in a world which besides the age distribution (and in our case education and family type) looked exactly like the world today, it ignores that even under these simplifying assumptions the economy would be different, as changes in labour relative to capital input would alter wages and the interest rate. To overcome this shortcoming, Lee & Mason (2017) introduced some elements of general equilibrium into their projection capturing to some extent changes in factor prices (wages and interest rates) resulting from changes in the relative size of capital and labour. They also introduced another indicator (the Impact Index, IMP) which complements the SR and allows capturing those changes in prices. The Impact Index measures the changing relation between resources available for consumption (total income, from labour and assets, net of savings, and effective consumers. The calculation of these indexes is affected by wages and interest rates resulting from a simple aggregate production function. Hence this index can be computed both for a closed economy (changing wages and interest rates) and an open economy (constant interest rate). As in the case of the Support Ratio, we apply the microWELT model to calculate and project the Impact Index using disaggregated NTA data.
This paper is organised in five parts. The first part gives an overview of the microWELT model and its rational and application from the perspective of the present research. The second part introduces the NTA approach and the disaggregated NTA data used for our analysis. Both parts are kept very short as extensive documentation of model and data are available in separate papers (Spielauer et al. 2020a/b, Abio et al. 2020). The following two parts present the calculation and projection of the Support Ratio and the Impact Index and related analysis for the two studied countries. The final part discusses the meaningfulness of the various indicators and the potential role of microsimulation in adding realism to research based on the NTA approach. Definitions of all the variables of the model are collected in the Appendix.
The microWELT model
microWELT is a dynamic microsimulation platform developed for the study of the interactions between welfare state regimes, private and public welfare transfers, and population ageing accounting for educational change, life expectancy differentials by education, and changing family patterns. microWELT is developed at the Austrian Institute of Economic Research (WIFO) alongside an international research program studying the distributional effects of four welfare state regimes represented by Austria, Finland, UK, and Spain. The model is part of the WELTRANSIM project, funded by the Joint Programming Initiative “More Years, Better Lives”. Project partners are the University of Barcelona, the Finnish Institute for Economic Research, and the Finnish Centre for Pensions.
microWELT is a portable continuous-time interacting population model based on data readily available for many countries, most importantly the Euromod database. While reproducing existing (Eurostat) demographic projections in aggregate outcomes, microWELT also produces detailed family-demographic and education projections integrated with a longitudinal accounting framework based on the National Transfer Account (NTA) approach. Longitudinal accounting allows the calculation of Full Generational Accounts as in Lee et al. (2017). microWELT is fully documented and designed as a modular platform refinable and extendable for a wide range of applications going beyond the WELTRANSIM project.
The starting population is generated from 2010 EUROMOD (Sutherland and Figari, 2013) input data and various parameters are estimated directly from this data set. Other data sources are the harmonised European Labour Force Survey, Eurostat projections, NTA variables by age and sex developed in the Agenta Project as well as new disaggregated NTA data by age, sex, education and family type developed within the WELTRANSIM project.
microWELT reproduces Eurostat population projections concerning fertility, mortality rates by age and sex, as well as net migration numbers by age and sex. While meeting these aggregate targets due to alignment, the model accounts for the relative differences in rates by education. First birth rates (and thereby childlessness) are modelled by education. Also, the model accounts for the relative differences in mortality by education resulting in observed life expectancy differentials, while overall results are aligned to mortality by age and sex. microWELT models the intergenerational transmission of education which improves the longitudinal consistency of economic accounting over the life-course. For example, a person achieving higher education has a higher likelihood to have grown up with higher educated parents, thus having received higher family transfers as a child. Education (besides age, the presence of children in the family, and the age of the youngest child) also impacts on the likelihood of a woman to live in a partnership. In the simulation, partners are matched by observed distributions by age and education. Persons are linked to nuclear families. These links are maintained responding to events such as union formation, new partnerships, leaving home, and death.
The model implements a parallel parameterisation of NTA variables by three levels of disaggregation: by age, by age and sex, and by age, sex, education and family type. NTAs can be used to calculate indicators. Also, microWELT implements individual longitudinal accounts and mechanisms to balance national accounts over time.
Disaggregated NTA Data
NTA data are cross-sectional age profiles breaking down national accounting variables on consumption, income, saving, and transfers (public and private). Data distinguish between private and public consumption singling out education and health (United Nations, 2013). Public transfers also distinguish pension benefits. NTA data by sex are currently available for more than 50 countries (www.ntaccounts.org), including most European countries (agenta-project.eu). Alongside the WELTRANSIM Project, we further disaggregated NTA data by education and family type. microWELT allows the user to choose the aggregation level, allowing to compare simulation results based on aggregated profiles with simulations accounting for composition effects along the education and family dimensions. At their most disaggregated level, NTA variables in microWELT are parameterised by the following population groups:
- Children age 0-16 and students age 17-25: by parent’s education (the higher of both parents if available; students 17-25 not living with parents form an additional category)
- Non-students age 17-59: by sex, education, partnership status, and presence of children in the household
- Persons 60+ by sex, education, partnership status, and childlessness versus ever having had children
We distinguish three education levels, Low (ISCED 0-2), Medium (ISCED 3-4) and High (ISCED 5+). Family types are constructed according to partnership status and the presence of dependent children in the family (up to age 59) and childlessness (60+). Dependent children are children up to 16 and students up to 25 if living with parents.
NTA data provide a detailed picture of how resources are re-distributed through public and private transfers and asset re-allocation. microWELT implements a set of 19 NTA variables.
- Private Consumption Education (CFE)
- Private Consumption Health (CFH)
- Private Consumption other than Education and Health (CFX)
- Public Consumption Education (CGE)
- Public Consumption Health (CGH)
- Public Consumption other than Education and Health (CGX)
- Public Transfers Pensions, Inflows (TGSOAI)
- Public Transfers Other Cash Inflows (TGXCI)
- Public Transfers Other In-Kind Inflows (TGXII)
- Public Transfers Education Inflows (TGEI)
- Public Transfers Health Inflows (TGHI)
- Public Transfers Outflows (TGO)
- Net Interhousehold Transfers (TFB)
- Net Intrahousehold Transfers (TFW)
- Private Saving (SF)
- Public Saving (SG)
- Labour Income (Yl)
- Private Asset Income (YAF)
- Public Asset Income (YAG)
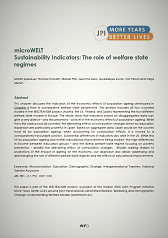
Figure 1 illustrates NTA shapes for labour income and total consumption by education. (For children and students up to 25, education refers to parents’ education.) Labour income is concentrated on work age, higher educated people reaching higher incomes, especially later in their work career, and working until a higher age. At the peak, the average labour income in the high education group is much higher (up to 3 times in Austria) than in the low education group. Consumption is much smoother; also, the differences between education groups are smaller, adult people in the high education group consuming around 50% more than in the lowest group.
Consumption profiles are flatter when using aggregate NTA data, whereas the consumption profiles disaggregated by education increase clearly over age. This is a consequence of the different educational compositions in the various age groups and illustrates one of the problems in the application of the current aggregated cross-sectional profiles in the future.
Figure 1: NTA age profiles of labour income and consumption
Source: Simulation output based on NTA data by education and family type developed in the WELTRANSIM project.
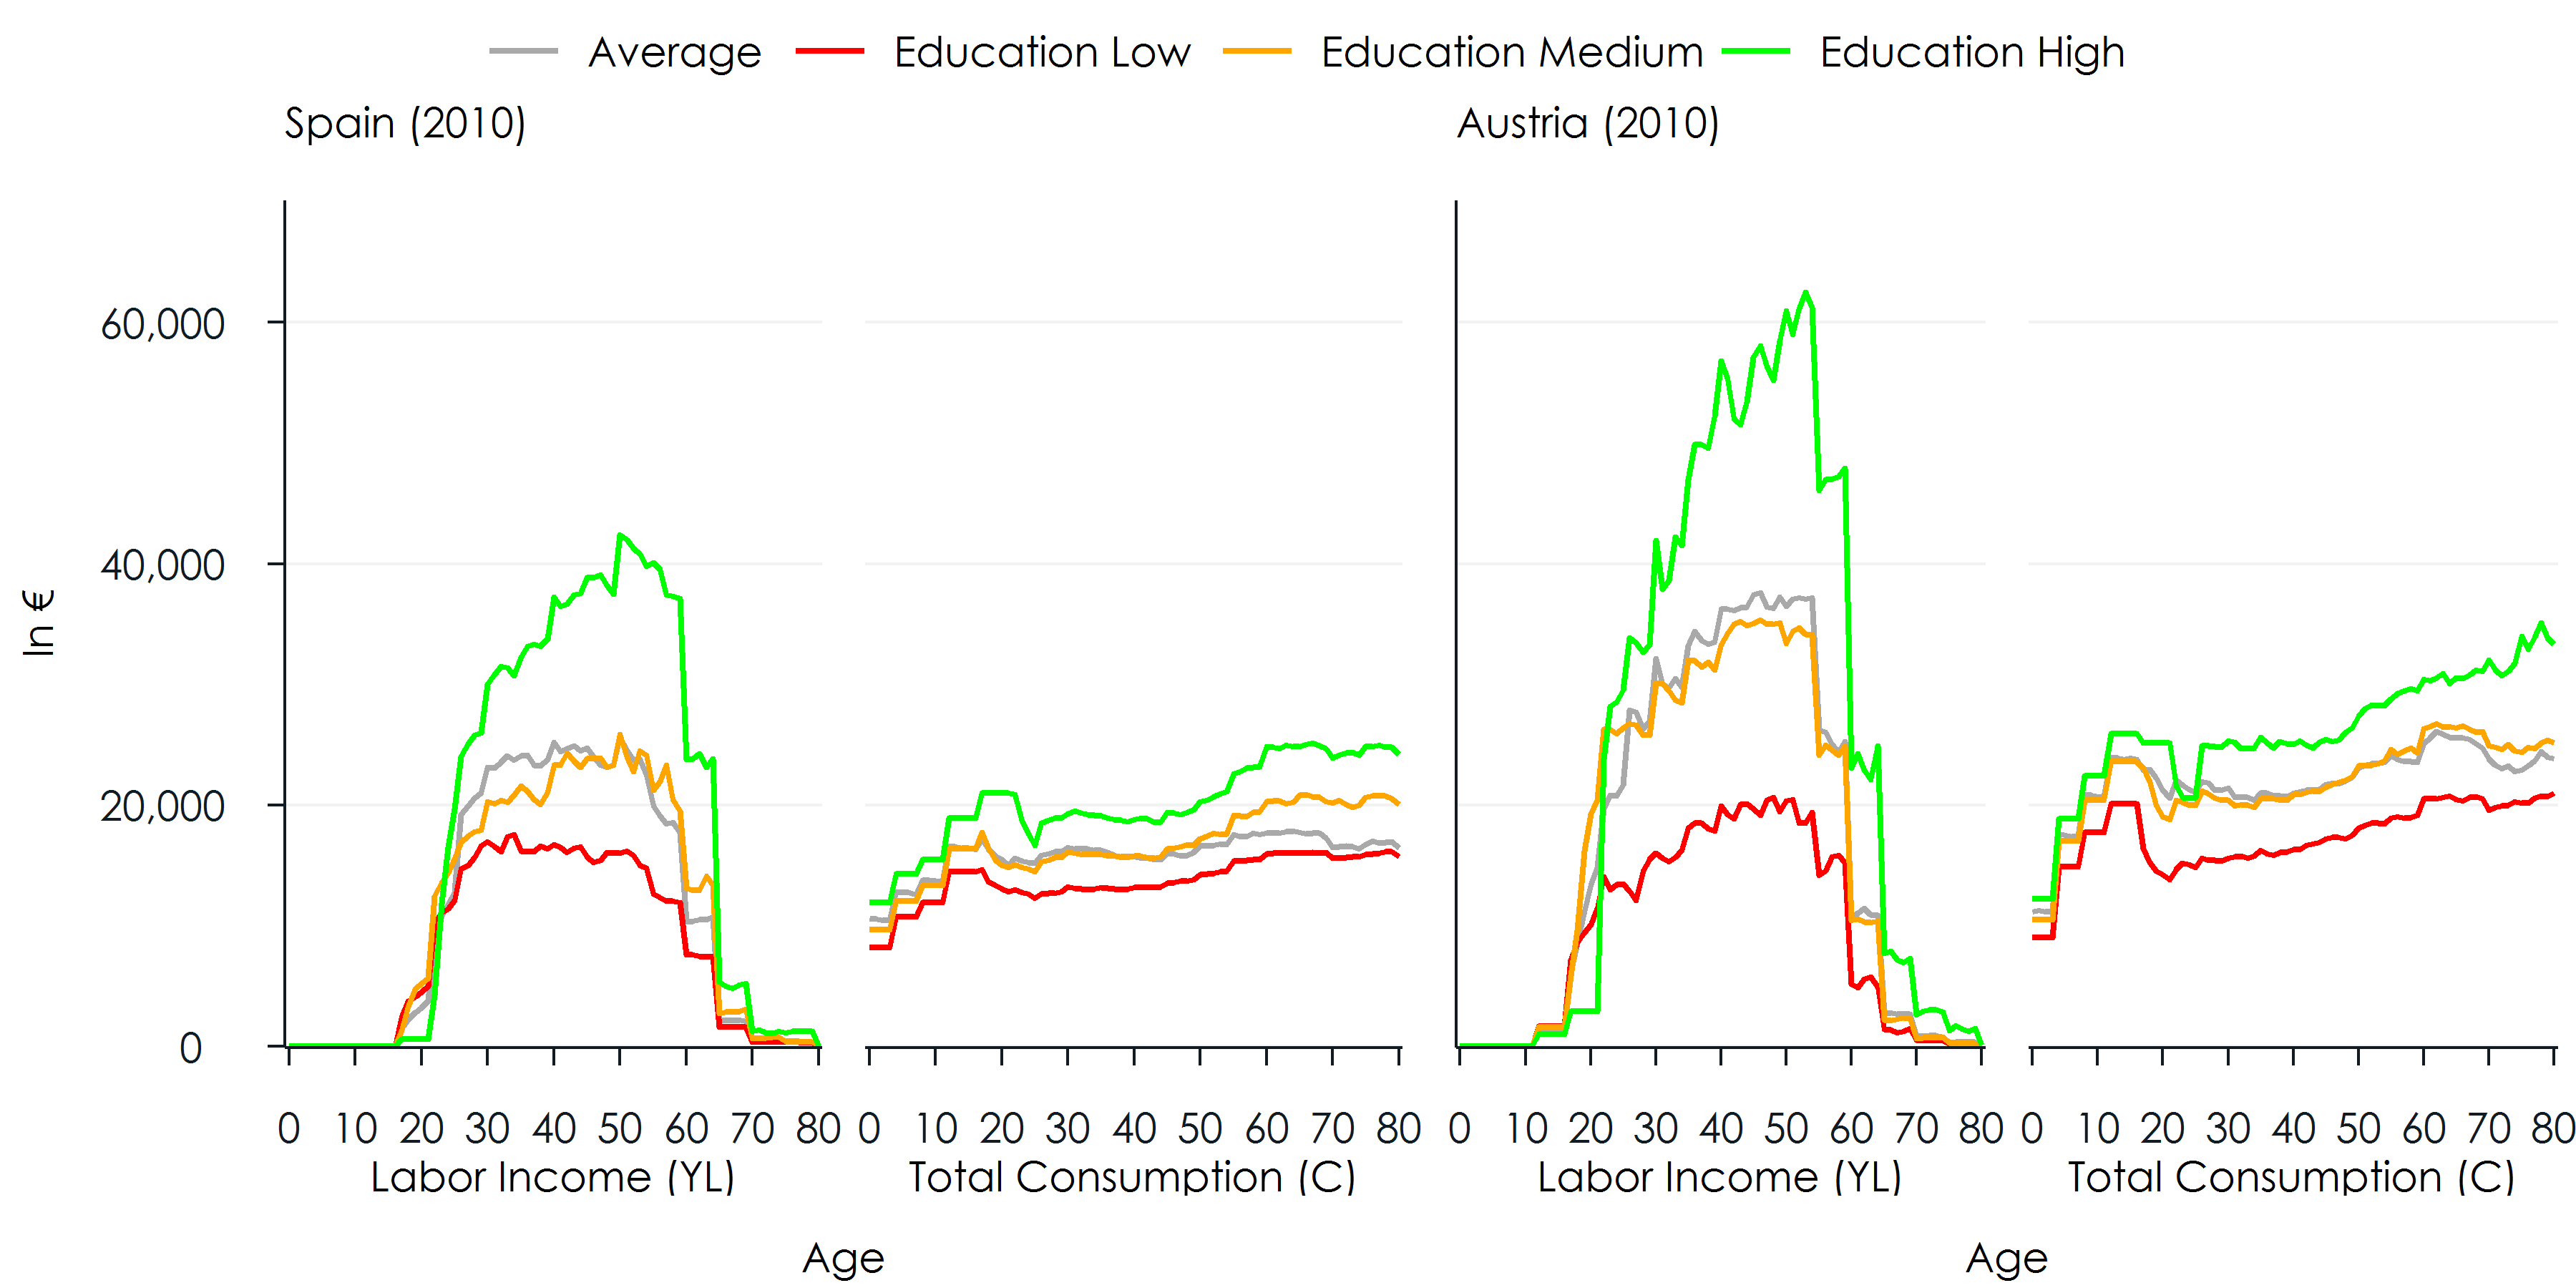
The difference between labour income and consumption is a result of transfers – both private and public – and asset re-allocation (asset income minus dissaving). Figure 2 depicts the age profiles of private and public net transfers by education.
Figure 2: NTA age profiles of public and private net transfers
Source: Simulation output based on NTA data by education and family type developed in the WELTRANSIM project.
A comparison between the transfers in Spain and Austria reveals almost similar patterns and absolute magnitudes (in €) for family transfers; given the lower labour income in Spain, family transfers are thus higher in Spain in relative terms. In contrast, public transfers are higher in Austria in absolute terms, the difference being in the range of differences in labour income. Differences by education are very pronounced – both in magnitude and shape – especially regarding public net transfers.
The Support Ratio
The Support Ratio, expressed as an index set to 1 in the base year, shows the change in the relationship between available labour income to the current level of consumption in the absence of relative changes in the age profiles of consumption and labour.
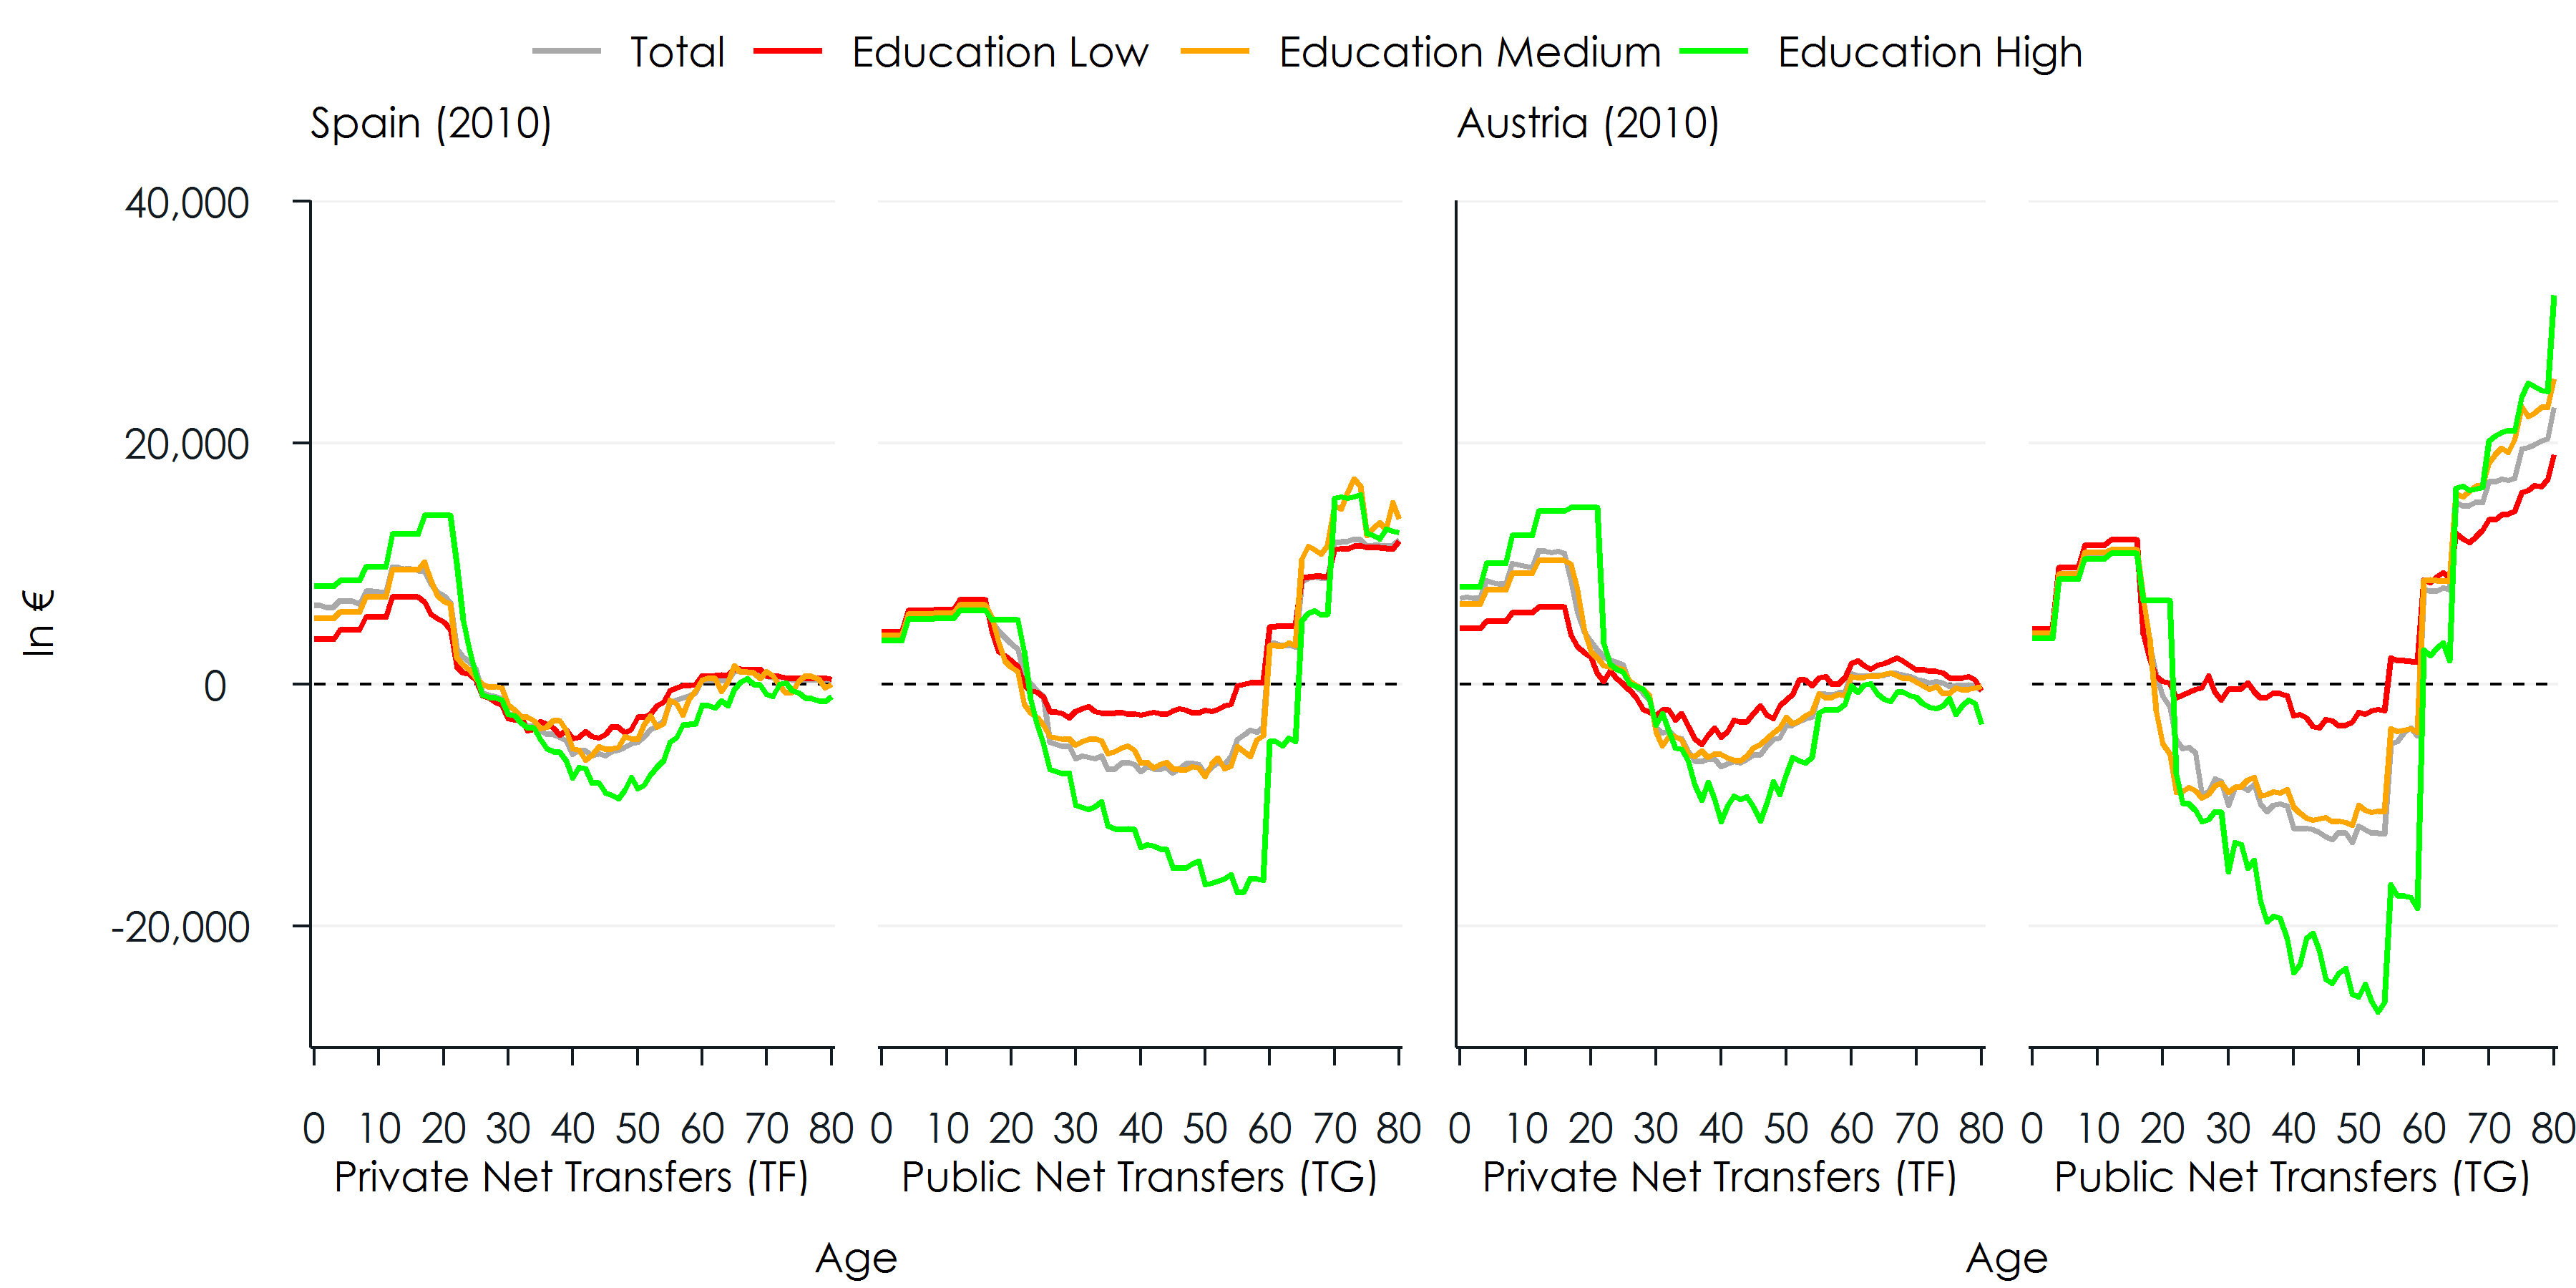
Basing the calculation of the Support Ratio on disaggregated NTA data developed in the WELTRASNIM Project, composition changes affect both the effective labour and effective consumption. Figure 3 compares the changes in the two measures calculated based on disaggregated NTA data to the measures based on NTA by age only. Effective labour is simply the current (2010) age profile of labour income, as depicted in Figure 1, re-weighted by projected population numbers, set into relation to the initial 2010 value. Effective consumers are calculated accordingly based on the age profiles of total consumption. The effects of (not) ignoring composition effects are considerable: e.g. for Spain, changes in effective consumers are double as high when basing the calculation on disaggregated NTAs.
Figure 3: Effective Labour (L) and Effective Consumers (N)
Source: Simulation output based on NTA data by education and family type (WELTRANSIM project) compared to outcomes based on aggregate NTAs (AGENTA project).
The Support Ratio is calculated by dividing the index of Effective Labour by the index of Effective Consumers. In Figure 4, we compare four measures:
- As a reference, we construct an index of the relation of the population 18-64 to the total population. This is a purely demographic index of the sort NTA literature attempts to improve by applying age profiles instead of arbitrary age brackets.
- The Support Ratio based on aggregated NTAs by age. Both for Spain and Austria, the application of current age profiles of consumption and labour leads to a higher decline of the index compared to the demographic reference index.
- The Support Ratio based on disaggregated NTAs. Composition effects are favourable in both Spain and Austria. This is especially the case in Spain, where the decline in the index is now even less when compared to the purely demographic index. In Austria, the effect is smaller; in the long run, the positive effect of higher labour input is cancelled out by the relatively high consumption of higher educated elderly.
- The fourth index relates the changes in effective labour based on disaggregated NTA to the change in effective consumers based on aggregated NTA. This indicator thus measures to which extent today’s consumption by age can be maintained accounting for the changing education composition of the population, without maintaining the consumption standards within each education group. Results show that the changing population composition by education does not outweigh the ageing effect.
Figure 4: Support Ratios
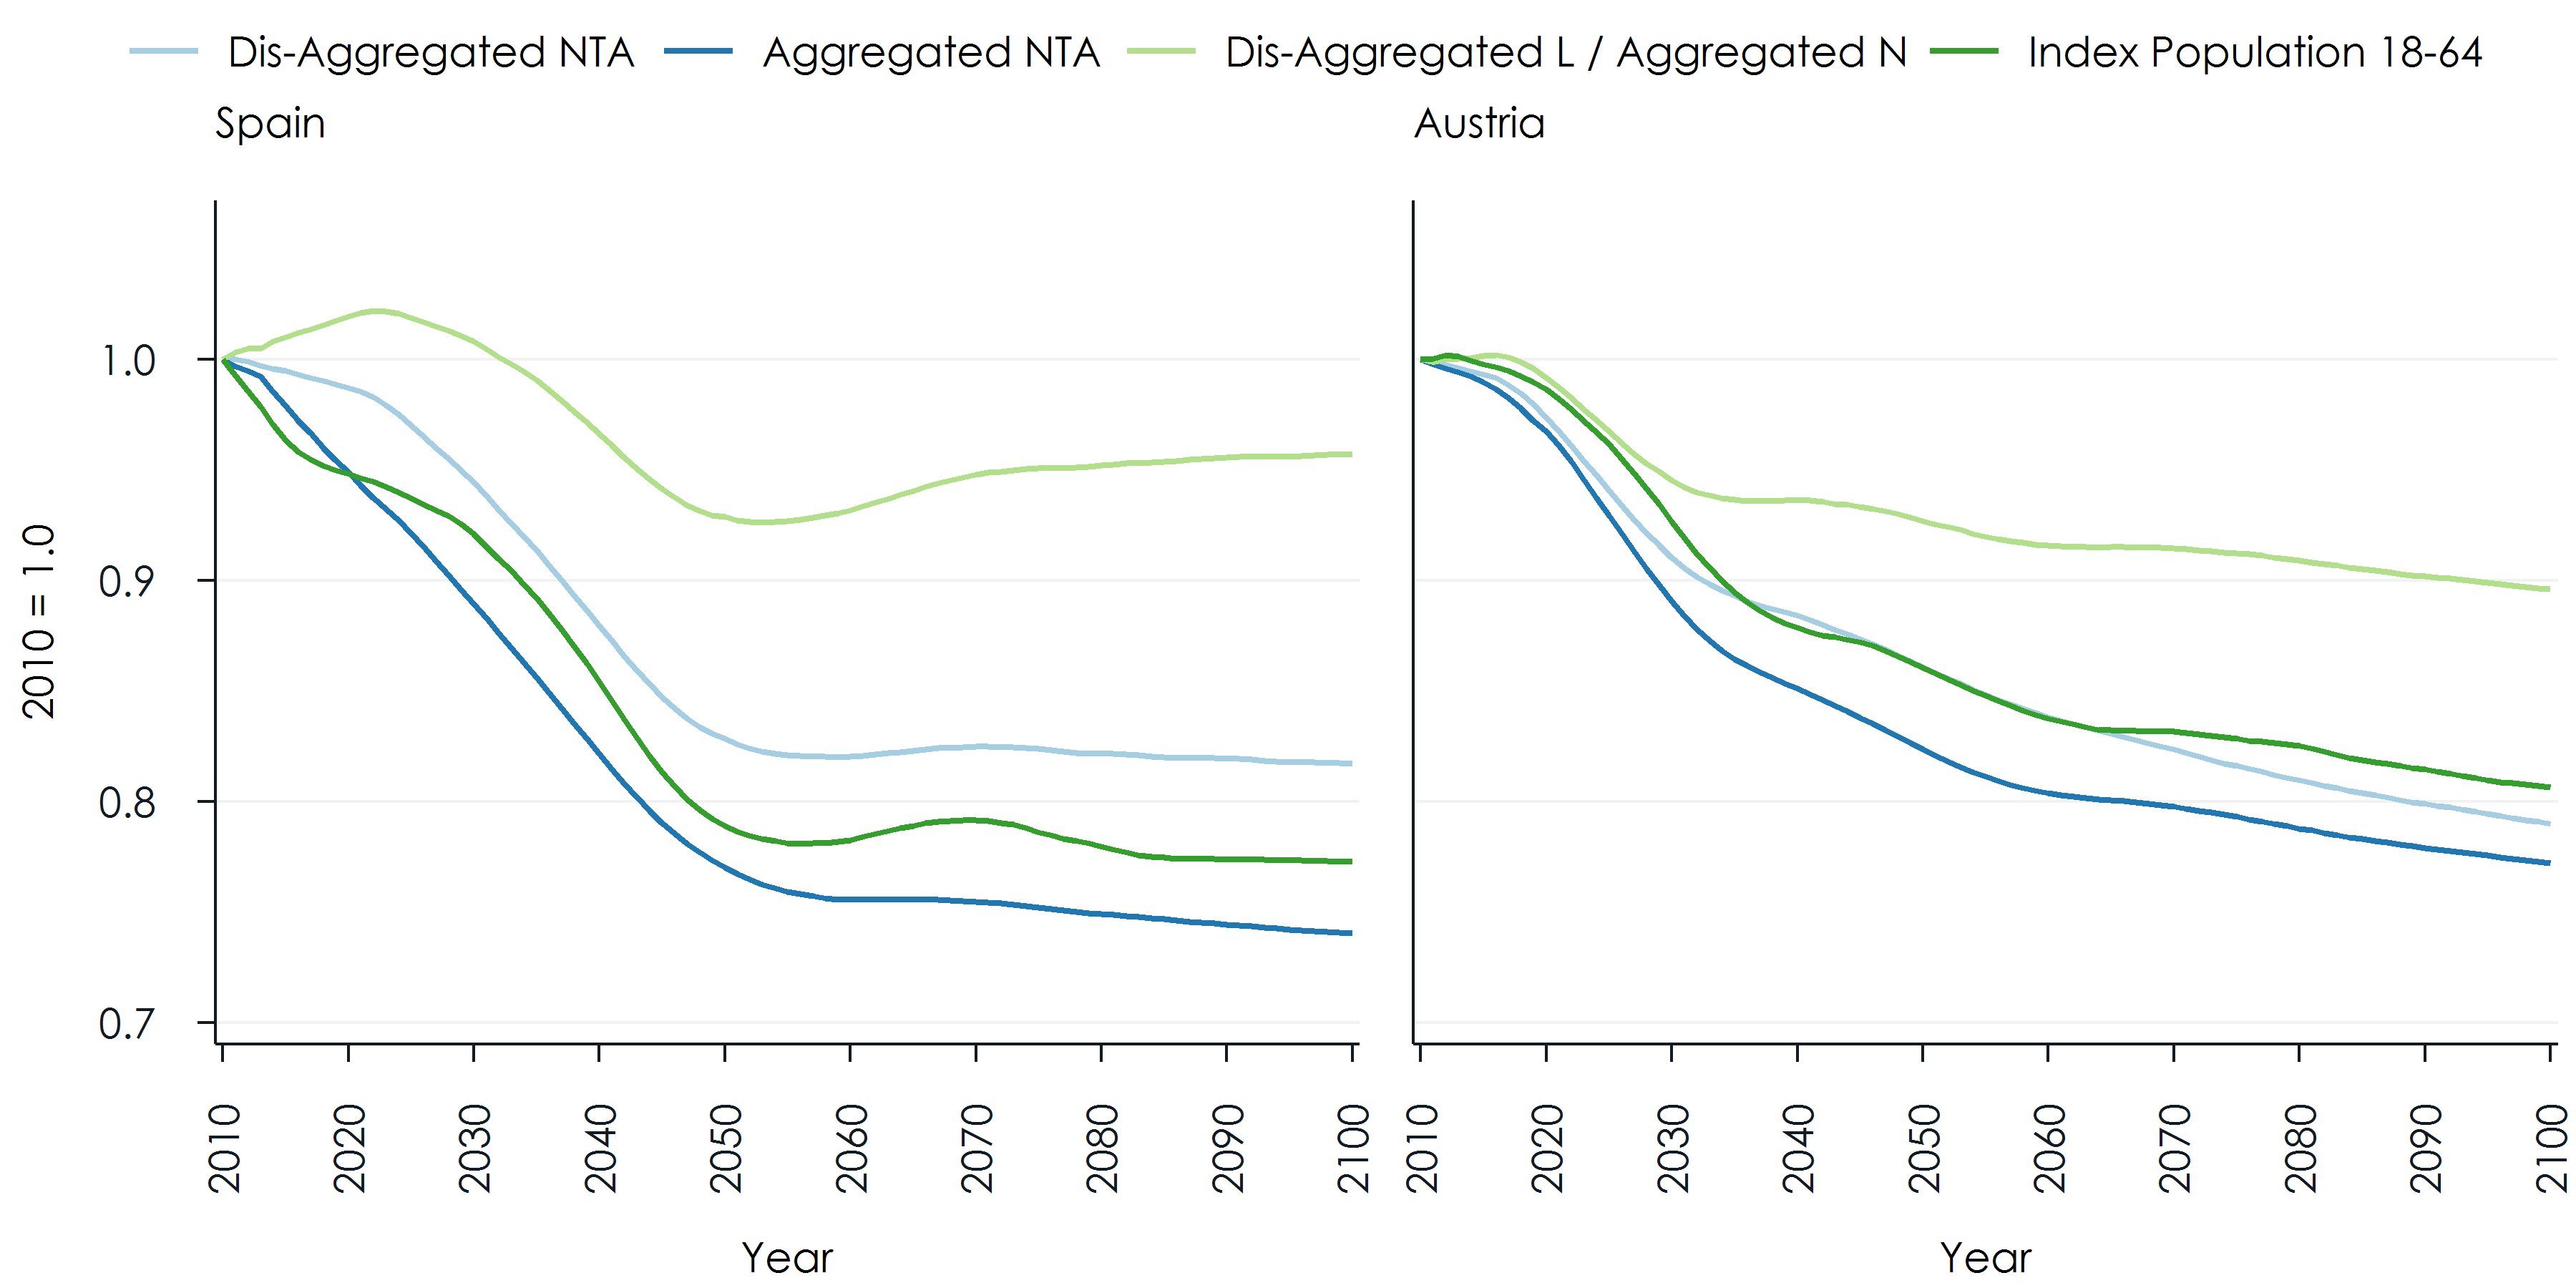
Source: Simulation output based on NTA data by education and family type (WELTRANSIM project) compared to outcomes based on aggregate NTAs (AGENTA project).
Comparing the four indicators reveals some of the problems of an indicator based on aggregate NTAs.
- NTA literature promotes the Support Ratio as a more realistic indicator of the effect of population ageing compared to purely demographic measures based on the relation of age groups. They find that for Europe, the Support Ratio gives a more dramatic outlook than purely demographic measures (Prskawetz & Sambt 2014). Our study shows that, when accounting for composition effects, these results can be reversed. Also, our analysis indicates similar trends, while the size of these results is very country-specific.
- NTA measures based on aggregate NTAs not only ignore improvements in human capital; the indicator is also based on average age-specific consumption. As an indicator of the extent to which the living standard of a population can be maintained, it refers to the average population by age and not to the maintenance of the relative consumption standards as observed today for given population groups by education and other characteristics. Our results show that when using aggregate consumption by age as the standard reference, a much higher level of consumption can be maintained due to composition effects: for Spain, in the long run, 90% of the current age-specific consumption can be maintained, compared to 75% indicated by the Support Ratio based on aggregated NTAs.
The disaggregated NTAs developed in the WELTRANSIM Project do not only distinguish by education, but also family type. The rationale is to provide measures which allow for the distributional study not only by education but also by family, especially between people with and without children. As a tool for comparative studies, including a longitudinal perspective, microWELT projections account for longevity differentials by education. In order to assess to which extent such detail not only allows distributional studies but also impacts summary measures such as the Support Ratio, we created two what-if scenarios:
- In Scenario A, we “switch off” the relative mortality differences by education. This scenario does not affect overall age-specific mortality, but who – at a given age and for given sex – dies. This scenario thus ignores that people with higher education on average not only consume more but also live longer lives.
- In Scenario B, we study the effect of the differences in the distribution of family sizes by education (the concentration of reproduction; see Spielauer 2005 and Shkolnikov et al. 2004) on the Support Ratio. While microWELT accounts for differences in timing and quantum of fertility by education, in this scenario we assume a low concentration of reproduction setting childlessness to a very low level (of 5%) regardless of education and applying the same fertility patterns to all education groups. This scenario does not affect overall age-specific fertility rates but distributes children more evenly among women.
Figure 5 depicts the effect of mortality and fertility differentials by education on the Support Ratio. As can be expected, ignoring longevity differentials would lead to a smaller decline in the Support Ratio. The effect of the concentration of reproduction is of comparable magnitude, but in the case of Austria goes in the opposite direction.
Figure 5: The effect of mortality and fertility differentials on the Support Ratio
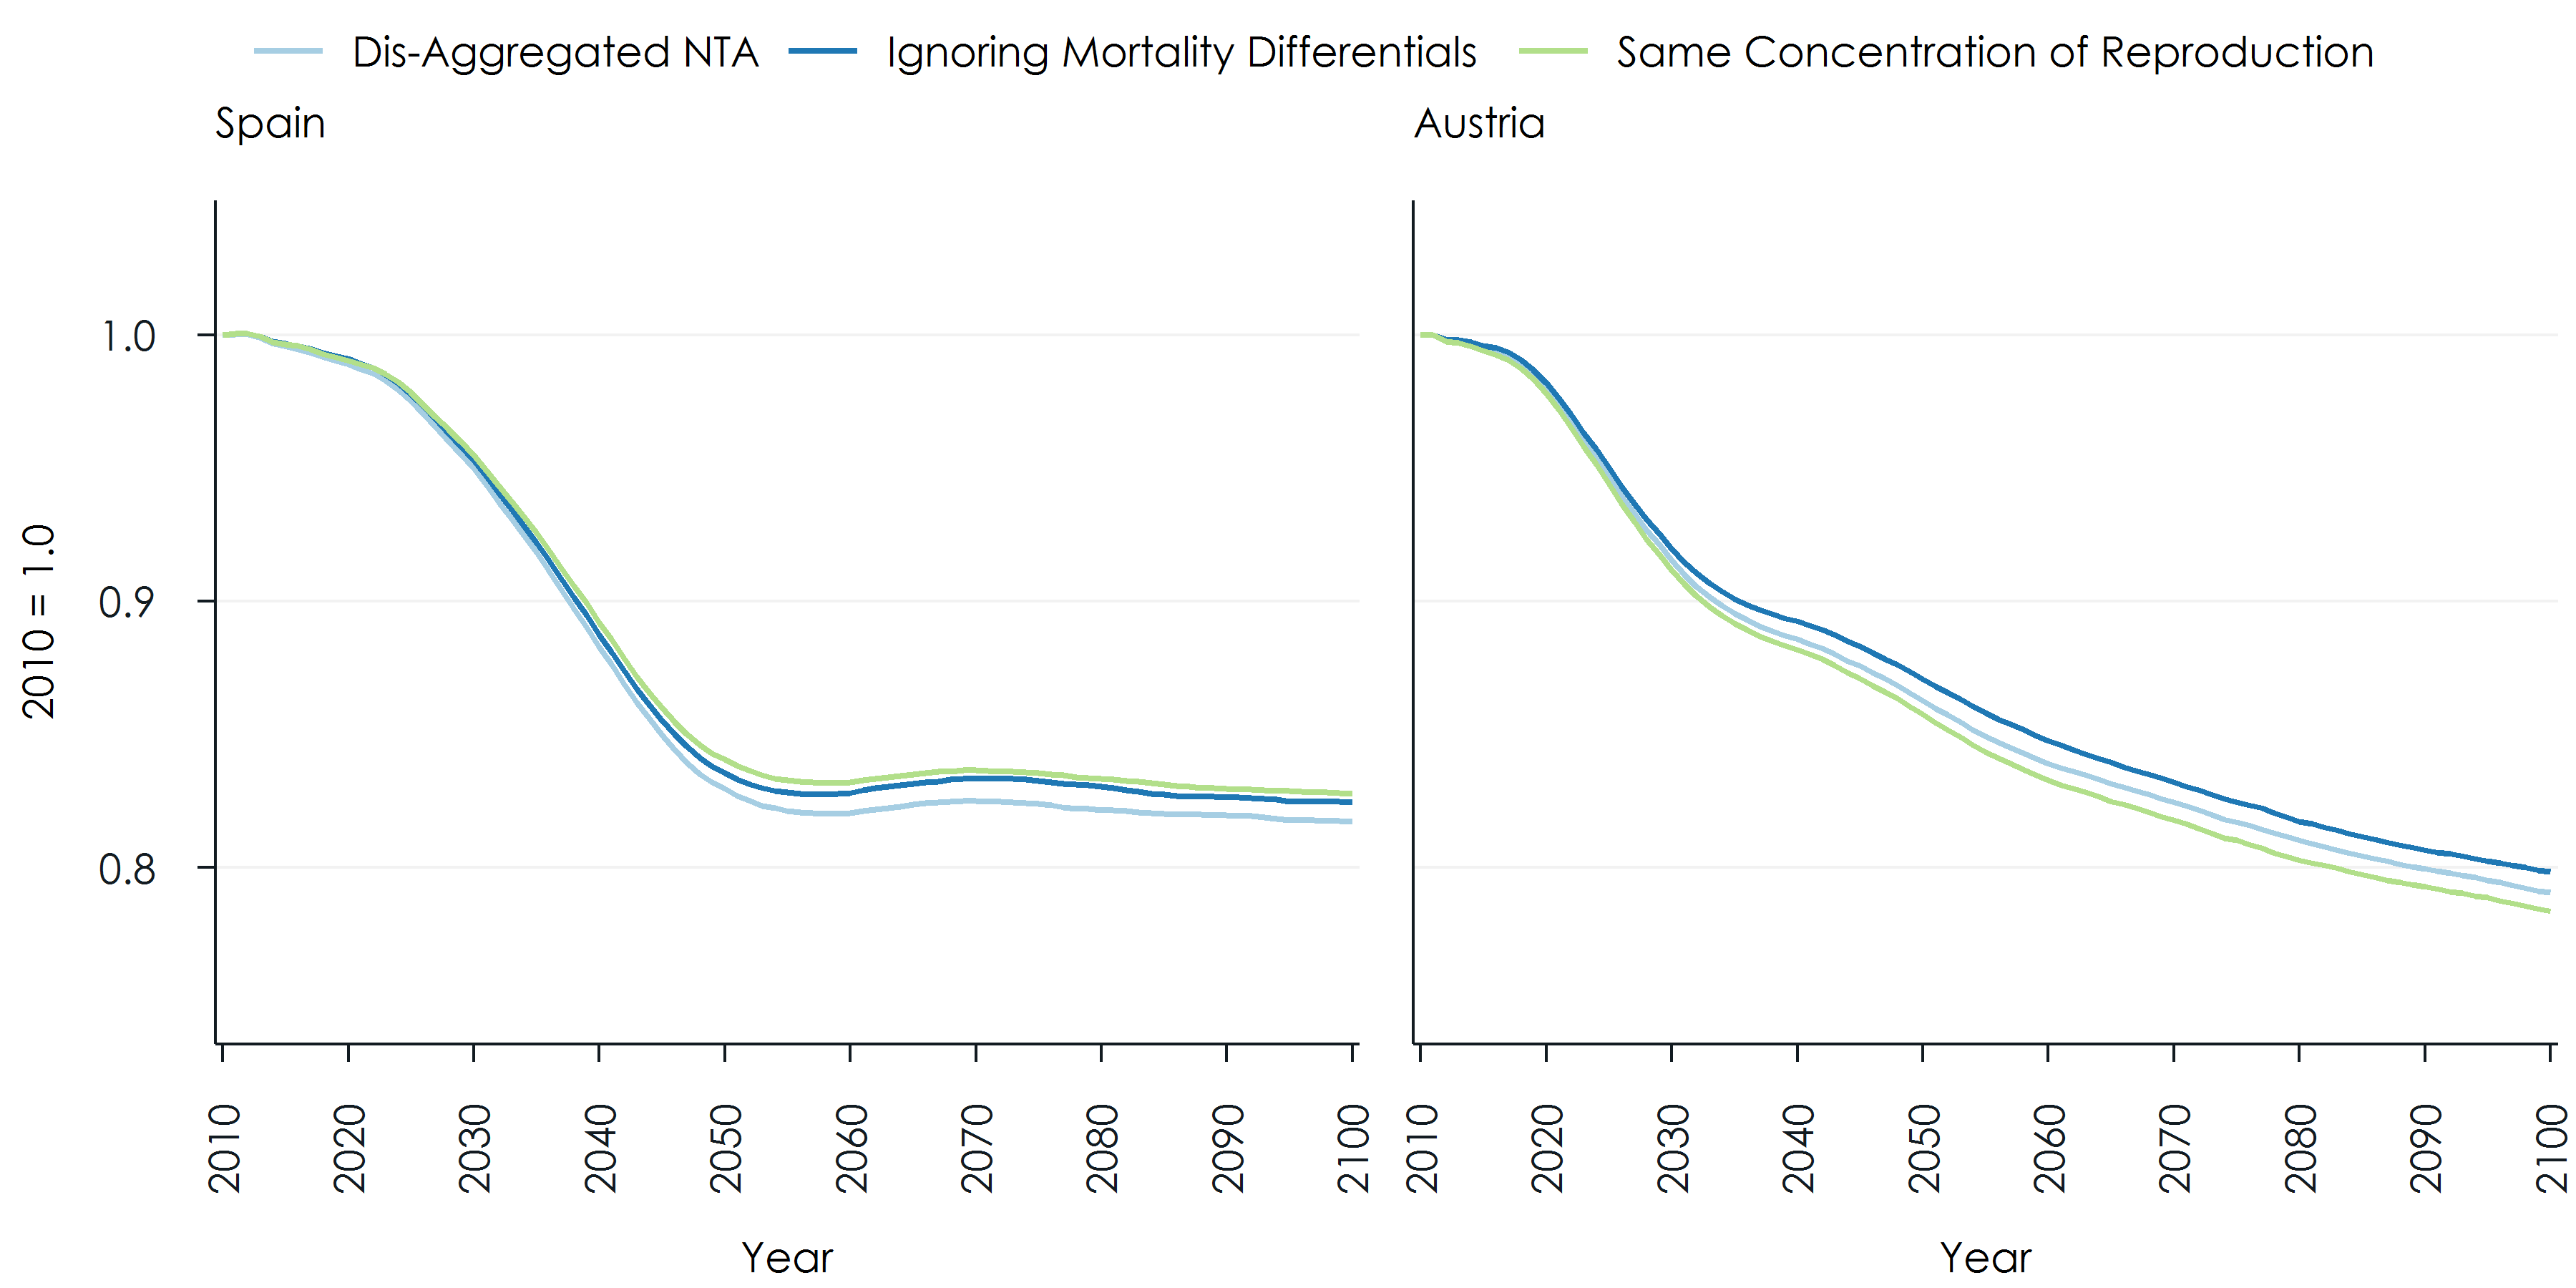
Source: Simulation output based on NTA data by education and family type developed in the WELTRANSIM project.
The Impact Index
While the Support Ratio aims at providing an indicator of how the ratio of labour input and (age-weighted) consumption would be different in a world which besides the distribution by age (and in our case education and family type) looked exactly like the world today, it ignores that even under these simplifying assumptions the economy would be different, as changes in labour relative to capital input would alter wages and the interest rate. To overcome this shortcoming, Lee & Mason (2017) developed the Impact Index. In contrast to the Support Ratio, the Impact Index is a broader measure which contains more information and permits taking into account changes in wages and interest rates resulting from the changing labour supply in relation to capital due to demographic change. The Impact Index measures the change in the relationship between resources available for consumption and the consumption level needed to keep the initial standards. Compared to the Support Ratio, the Impact Index replaces “effective producers” (a measure for labour input) with the consumption which would be possible accounting for changes in wages and capital income assuming a constant age-specific saving rate as observed today.
As in ageing societies, labour becomes relatively scarcer, wages increase, softening the consequence of ageing on future consumption. Calculation of future production as a function of capital and labour input requires the choice of a production function. The Impact Index applies a Cobb Douglas assuming for simplicity that the productivity growth is null. Besides the information required to calculate the Support Ratio, the only additional information required is an initial interest rate (as in Lee & Mason 2017, we use 4% for our illustrations). NTAs do not contain information on capital stocks. As a proxy, initial capital endowment by age is calculated based on the assumed interest rate and kept constant in the simulation. In contrast, wages and interest rates adapt to population change, assuming a closed economy, whereas only wages adapt in the open economy version. While the saving rate is used for calculating consumption, there is no longitudinal consistency between savings and the stocks of capital, which are entirely based on today’s estimated stocks by age. (See Sánchez-Romero et al. 2013 for an alternative approach which better captures the general equilibrium macroeconomic effects at the cost of less disaggregation.) The equations behind the model calculations of the Impact Index are presented in the Appendix.
In Figure 6, we depict the Impact Index comparing simulations based on aggregated versus disaggregated NTA data and contrasting these indicators to Support Ratios. The effects are considerable, both (1) accounting for the gap between consumption needs and total available income net of savings, and changes in prices compared to the SR (based on constant labour input), and (2) basing the analysis on disaggregated data. For Spain, assuming an open economy, in the long run, 90% of consumption could be maintained without changes in price increases in labour force participation when using disaggregated data, compared to 80% when using aggregate data. In contrast, the Support Ratio would decrease to below 75%. The effects in Austria are similar in direction but smaller.
Figure 6: The Impact Index compared to the Support Ratio
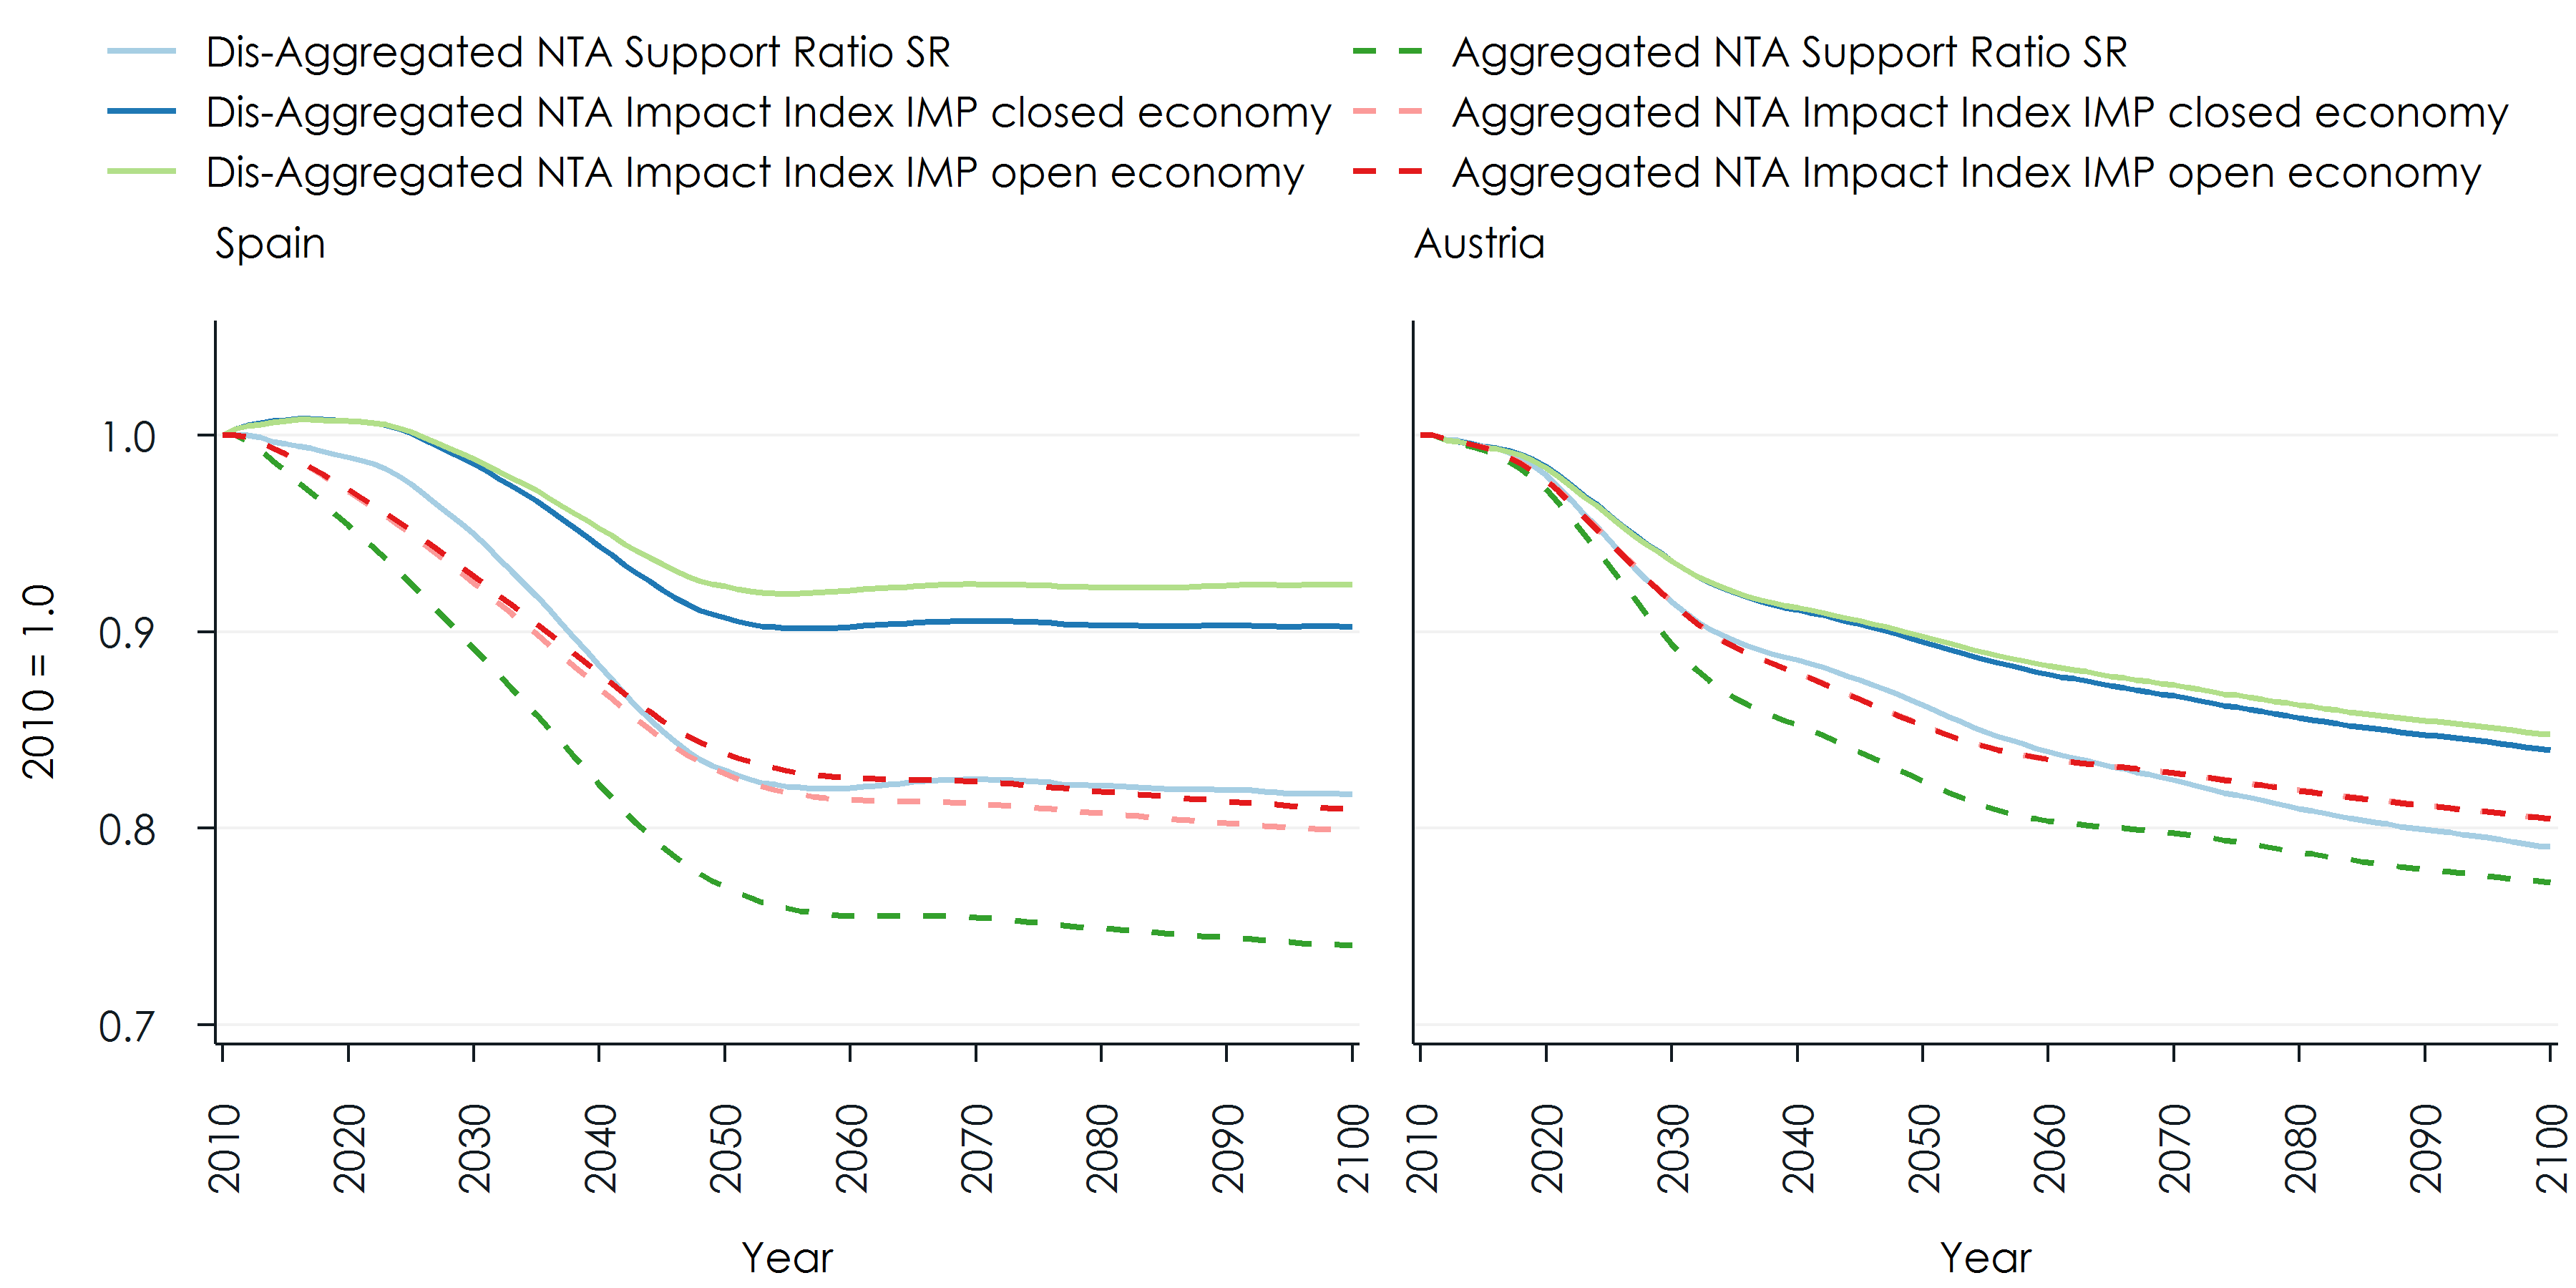
Source: Simulation output based on NTA data by education and family type (WELTRANSIM project) compared to outcomes based on aggregate NTAs (AGENTA project).
Basing the Impact Index on disaggregated NTAs alleviates the burden of population ageing by two effects. The first – as mentioned above – stems from an increasing wage rate as labour becomes relatively scarce. Additionally, the simple mechanics behind the calculation of the Impact Factor also leads to a much higher increase in available capital, as the capital endowment by age and education is assumed to be constant and observed endowments are considerably higher for higher educated people driving up capital stocks by composition effects. Consumption thus increases both due to higher wages and higher capital income. The latter effect is particularly strong in Spain, leading to a situation, where a closed economy (with lower interest rates) would result in a higher decrease of the Impact Factor than an open economy.
Both the Support Ratio and the Impact Index take “effective consumers” (N) in the denominator. As the number of effective consumers changes when applying disaggregated NTAs, this thus also affects the Impact Index and its interpretation: using aggregated NTAs, we express how future consumption is related to today’s consumption by age only. Using disaggregate NTAs, we relate future consumption to consumption accounting for the differences in consumption levels between education groups. In Figure 7 we compare three versions of the Impact Index calculated by different combinations of aggregated and disaggregated NTAs. Relating the future consumption based on disaggregated NTAs to today’s consumption based on aggregated NTAs, in the Spanish case, the Impact Index stays above or close to 1 over the whole projection horizon. Changes in the education composition thus compensate for the effect of ageing when considering consumption by age. In the Austrian case, also this variant of the Impact Index declines over time, whereas far less than other variants.
Figure 7: The Impact Index compared to the Support Ratio for different variants of aggregation
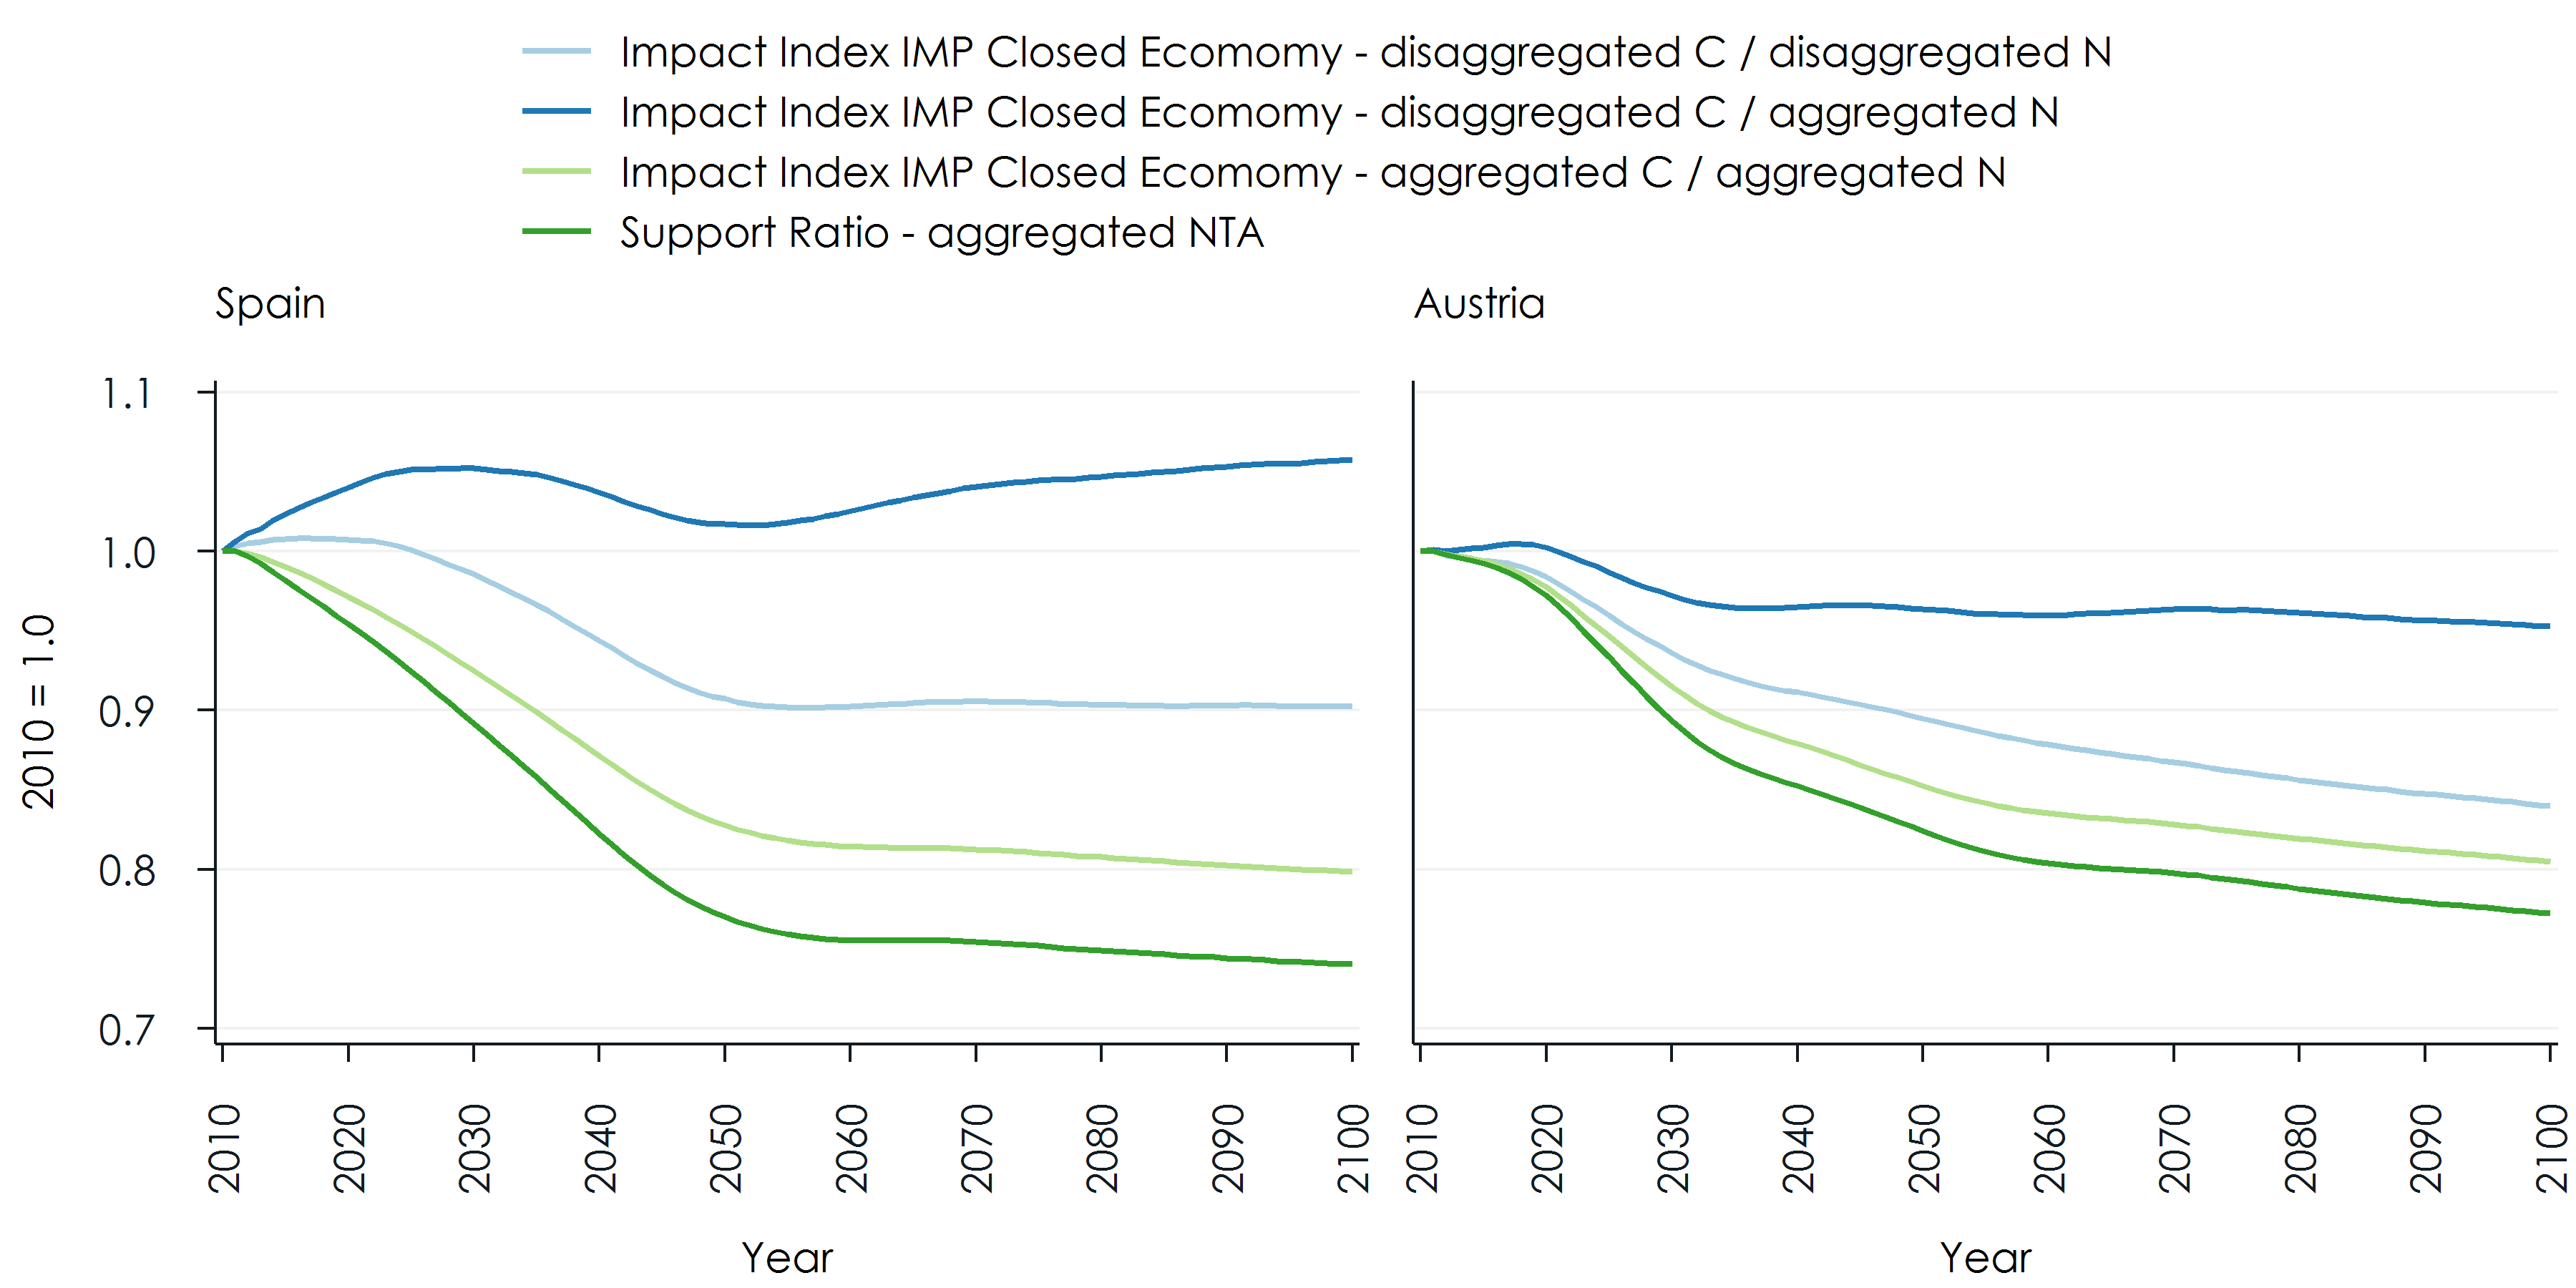
Source: Simulation output based on NTA data by education and family (WELTRANSIM project) compared to outcomes based on aggregate NTAs (AGENTA project).
Discussion
This paper studied how changes in the population composition by education and family characteristics impact on indicators of the economic effects of population ageing based on National Transfer Accounts (NTAs). Results for two indicators developed in the NTA literature were compared to results based on NTAs by education and family type: The Support Ratio and the Impact Factor.
Our projection analysis was performed using the dynamic microsimulation model microWELT, which provides the required detailed socio-demographic projections and incorporates the NTA accounting framework. Our results show that indicators based on disaggregated data give a very distinct picture of the economic effects of population ageing, as the burden of ageing is considerably alleviated by the education expansion
The Support Ratio was introduced in order to overcome the shortcomings of a pure demographic measure of economic dependency, based entirely on age, claiming that applying age profiles of economic profiles as observed today can give a more realistic outlook of the economic burden of ageing which for European countries seem to be more severe when measured by the Support Ratio. Accounting for the composition effects introduced by education expansion, we show that these results are reversed in the case of Spain, while for Austria, the Support ratio stays below the purely demographic measure.
The Impact Index adds a simple economic model to the calculation of an indicator of the burden of ageing, introducing wage and interest rate reactions which increase the consumption potential in the future due to higher wages, and a higher capital endowment of an aged population. Again, when basing the Impact Index on disaggregated NTAs, results change considerably.
The calculation of the two indicators based on disaggregated NTAs constitutes a first – and simple – application of the microWELT microsimulation model. Detailed population projections are key for introducing realism to indicators of the burden of population ageing. Microsimulation projections, by depicting essential aspects of population heterogeneity, additionally allow the assessment of distributional effects both cross-sectionally and longitudinally with measures based on the whole life-courses of individuals. microWELT also provides a platform for more realistic economic modelling, overcoming some problematic assumptions, e.g. by explicitly modelling capital accumulation.
This paper is part of a series of related papers and other resources which together build comprehensive documentation and presentation of the research performed developing and using microWELT. All materials are available at the project website www.microWELT.eu. One of the objectives of microWELT is the provision of a modelling platform ready for applications beyond the WELTRANSIM project. A collection of project descriptions and links to these projects is provided on the project website. microWELT is an open-source project: the application, the model code, a step-by-step implementation guide as well as analysis scripts for parameter generation are available for download.
References
- Abio, Gemma, Patxot, Concepció, Souto, Guadalupe, Istenič, Tanja (2020),
Disaggregated National Transfer Accounts by Education and Family Types for
Spain, UK, Austria, and Finland. University of Barcelona, forthcoming. The
paper will be made available at the project website
www.weltransim.eu
- Cutler, D.M., Poterba, J.M., Sheiner, L.M., Summers, L.H. (1990), An Aging
Society: Opportunity or Challenge? Brooking Papers on Economic Activity 1990(1): 1–73.
- Doepke, M., Tertilt, M. (2016), Families in Macroeconomics, Handbook of
Macroeconomics, in: J. B. Taylor & Harald Uhlig (ed.),Handbook of
Macroeconomics, edition 1, volume 2, chapter 0, pages 1789-1891, Elsevier.
- Lee, Ronald, Mason, Andrew (2017), Some Economic Impacts of Changing
Population Age Distributions - Capital, Labor and Transfers. Paper prepared
for the 2017 World Congress of the IUSSP in Cape Town. pdf.
- Lee, Ronald, McCarthy, David, Sefton, James, Sambt, Jože (2017), Full
Generational Accounts: What Do We Give to the Next Generation? Population
and Development Review 43(4): 695–720.
- Mason, A., Lee, R. (2006), Reform and support systems for the elderly in
developing countries: Capturing the second demographic dividend, GENUS 52(2): 11–35.
- Mejía-Guevara, Ivan, Rentería, Elisenda, Patxot, Ció, Souto, Guadalupe
(2016), The effect of education on the demographic dividend, Population and
Development Review, 42, 4, 651-671.
- Patxot, Ció, Renteria, Elisenda, Sánchez-Romero, Miguel, Souto, Guadalupe (2011), Integrated results for GA and NTA for Spain: some implications for the sustainability of welfare state, Moneda y Crédito, 23:7-51.
- Prskawetz, Alexia, Sambt, Jože (2014), Economic support ratios and the
demographic dividend in Europe - Demographic Research: Volume 30, Article 34.
- Sánchez-Romero, M., Patxot, C., Rentería, E., Souto, G. (2013), On the
Effects of Public and Private Transfers on Capital Accumulation: Some
Lessons from the NTA Aggregates, Journal of Population Economics, 26, 1409-1430.
- Shkolnikov, Vladimir, Andreev, E.M., Houle, Rene, Vaupel, J.W. (2004), The
concentration of reproduction in cohorts of US and European women. Max
Planck Institute for Demographic Research WP-2004-027.
pdf.
- Spielauer, Martin, Horvath, Thomas, Fink, Marian (2020a), microWELT: A
Dynamic Microsimulation Model for the Study of Welfare Transfer Flows in
Ageing Societies from a Comparative Welfare State Perspective. WIFO Working
Paper 2020.
- Spielauer, Martin, Hyll, Walter, Horvath, Thomas (2020b), microWELT:
Socio-Demographic Parameters and Projections for Austria, Spain, Finland and
the UK. WIFO Working Paper 2020.
- Spielauer, Martin (2005), concentration of reproduction in Austria: general
trends and differentials by educational attainment and urban-rural setting.
In: Vienna yearbook of population research 2005.
- Sutherland, Holly, Figari, Francesco (2013), EUROMOD: The European Union
tax-benefit microsimulation model. International Journal of Microsimulation. 6. 4-26. 10.34196/ijm.00075.
pdf.
- United Nations (2013), National Transfer Accounts Manual: Measuring and Analysing the Generational Economy. United Nations Publications. pdf.
Appendix: Calculation of the Support Ratio and the Impact Index
Variables
yl(x) Average labour income age x
yk(x) Average capital income age x
P(x) Population age x
i(x) Average savings age x
s(x) Saving rate age x - constant
c(x) Average consumption age x (reference values for calculation of N)
L Labour
K Capital
I Saving
S Saving rate
C Consumption
r Interest rate
w Wage rate
Yl Labour Income
Yk Capital Income
Y Total Income Yl+Yk
α Alpha – constant
N Effective Consumers (population-weighted base-year consumption)
l(x) Average labour age x – constant
k(x) Average capital age x – constant
Cobb Douglas Production Function
Y = L^α K^(1- α)
Y = wL + rK
w = αY / L
r = (1- α) Y / K
Yl = wL = αY
Yk = rK = (1- α)Y
Known
yl(x) NTA data of reference year
yk(x) NTA data of reference year
i(x) NTA data of reference year
c(x) NTA data of reference year
P(x) NTA data of reference year
r parameter for reference year (used also to estimate the capital stock)
Calculated for initial year
Yl = ∑ yl(x) * P(x)
Yk = ∑ yk(x) * P(x)
Y = Yl + Yk
α = Yl / Y
K = Yk / r
L = ( Y / K^(1- α))^(1/α)
w = Yl / L
s(x) = i(x) / (yl(x) + ykx))
l(x) = yl (x) / w
k(x) = yk (x) / r
N = ∑ cl(x) * P(x)
Simulation: calculate for an updated population by age P(x)
(a) Closed Economy
L = ∑ l(x)* P(x)
K = ∑ k(x)* P(x)
Y = L^α K^(1- α)
Yl = αY
YK = (1- α)Y
w = αY / L
r = (1- α) Y / K
N = ∑ c(x) * P(x)
yl(x) = w * l(x)
yk(x) = r * k(x)
C = ∑ (1-s(x)) * (yl(x) + yk(x) ) * P(x)
(b) Open Economy (difference to closed)
r is given exogenously (and assumed constant in the simulation)
w = (Y – r * K) / L (following directly from the identity Y = w * L + r * K)
Yl = w * L
YK = r * K
Indices
SR = L / N Support Ratio (same for open and closed economy)
IMP = C / N Impact Index (different for closed and open economy)