Chapter 8: Accounts & Regimes

This chapter can also be downloaded as a pdf document
Spielauer, Martin, Thomas Horvath, Marian Fink, Gemma Abio, Guadalupe Souto, Ció Patxot and Tanja Istenič (2020) microWELT - Microsimulation Projection of Full Generational Accounts from a comparative welfare state perspective: Results for Spain, Austria, Finland, and the UK National Transfer Accounts Network Working Paper 20-03 pdf
Abstract
This paper investigates how different welfare regimes affect income redistribution both within generations and between generations in the face of population ageing. We compare countries representing different welfare state regimes (Spain, Austria, Finland and the United Kingdom). We apply the dynamic microsimulation model microWELT incorporating new disaggregated National Transfer Account (NTA) data. This bottom-up modelling strategy makes it possible to project the net present value of expected transfers for each generation and sociodemographic group. Our results contribute to the existing welfare regimes’ literature by measuring age-specific public and private transfers disaggregated by gender, educational level and family type. We find differences in the role of private and public transfers in the intra and intergenerational redistribution across countries, which can be linked to the various welfare state regimes. In Finland, the present value of public transfers received by the 2010 birth cohort is higher than private transfers, while in Austria both are almost the same. In contrast, in Spain and the UK, private transfers play the primary role. There are significant differences in the interplay between private and public transfers related to parenthood. While parents privately transfer substantially more than childless people in all studied countries, the Austrian welfare state fully compensates for these differences through public transfers to parents; such compensation is much weaker and more targeted towards the lower educated in the other countries.
Introduction
Generational Accounting proposed by Auerbach, Gokhale, and Kotlikoff (1991) is a stylised projection technique to evaluate the public budget’s sustainability by projecting the age profiles of tax payments and transfer receipts observed in the base year. In such a way, the net lifetime tax payments (net of transfer receipts) of living and future generations are estimated, which at the same time shows the intertemporal budget constraint of the public sector. While providing an interesting picture, it ignores private transfers, an essential dimension of the welfare systems. The National Transfer Accounts (NTA) project addresses this omission. The National Transfer Accounts (NTA) project addresses this omission. It develops a method to estimate the age profiles of income, public and family transfers, saving and consumption patterns consistent with National Accounts aggregates. Hence, both the size and aggregate pattern of welfare state transfers, together with private reallocations of resources, are reflected. In the WELTRANSIM project, NTA variables by educational level and family type were further disaggregated (Abio et al. 2020). Disaggregated NTA are incorporated as inputs in the microWELT simulation model.
In the past, authors have already combined Generational Accounting and NTA (see Patxot et al., 2011, 2012; Romero et al., 2019; Lee et al., 2017). Istenič et al. (2019) linked NTA with welfare state regimes. Our paper follows the strategy of Lee et al. (2017) constructing Full Generational Accounts (FGA, which include private transfers) but also incorporates the link to welfare regimes in Istenič et al., (2019). By employing disaggregated NTA variables in the analysis, the authors add to existing research by capturing sociodemographic changes beyond age, such as gender, educational level, and family type.
This chapter complements the analysis in Chapter 7 (Spielauer et al. 2020d), which introduces the used microsimulation modelling approach and accounting concepts of lifetime transfer payments and receipts of successive cohorts distinguishing between educational level and parenthood status. In contrast to Chapter 7, this paper includes representatives of all the welfare regime types, i.e. Mediterranean (Spain), conservative (Austria), social-democratic (Finland) and liberal (the UK). Furthermore, the results are connected to the welfare regimes’ literature that clearly shows the extent to which transfer regimes are connected with the characteristics of each welfare regime. This paper starts by reviewing the literature combining transfer systems with the welfare regimes and the main characteristics of different welfare regimes. The following sections are devoted to the presentation of our results and their link to the welfare regimes literature. Finally, section 5 presents the conclusions.
Welfare regimes’ theoretical framework
The connection between welfare regimes and transfer systems
The most well-known typology of welfares states (Esping Andersen, 1990) identifies three welfare regimes: conservative (Continental European), liberal (Anglo-Saxon), and social-democratic (Nordic). This typology is based on the concepts of de commodification and social stratification scores. The de commodification score shows the degree to which a welfare state permits’ people to make their living standards independent of pure market forces’ (Esping-Andersen, 1990, p. 3). Thus, the de-commodification score shows the degree to which people can maintain a socially acceptable standard of living independently of their market participation. On the other hand, social stratification shows how welfare states’ institutions articulate ‘social solidarity, division of class, and status differentials’ (Esping-Andersen, 1990, p. 55). Both characteristics are deeply connected to the NTA approach as NTA helps us evaluate the redistributive potential of the welfare states and the extent of the immunisation from the market dependency, which depends on the availability of alternative resource-allocation devices, i.e. government and family.
A large body of literature added additional key elements to the initial typology followed the Esping-Andersen’s (1990) work. One of the main criticisms in the European contexts was a need to separate Mediterranean and conservative countries, pointed out by Leibfried (1993) and Ferrera (1996). Another issue is Esping Andersen’s limitation to the work–welfare nexus, which was also admitted by Esping-Andersen (1999) himself. Authors have since started to add other welfare domains, such as the care–welfare nexus (Lewis, 1992; Esping-Andersen, 1999), education (Busemeyer, 2010; West & Nikolai, 2013), or health (Bambra, 2005). Additionally, Hernes (1987) pointed out the need to consider that ‘women-friendly welfare states’ promote women’s independence and encourage a minimum tension between their paid and unpaid work. The connection of the role of women and the care-welfare nexus leads to the inclusion of an additional dimension already identified by Saraceno (1996): The degree of de-familiarisation - the extent to which the state and/or the market relaxes the household’s welfare and caring responsibilities (Esping-Andersen, 1999).
The NTA estimations permit, for the first time, a thorough measurement of the contribution of the family to the welfare of economic dependents along the life cycle, taking into account at the same time the contribution of public transfers and the possibility that individuals accumulate resources along the life cycle through the asset market. Istenič et al. (2019) is the first direct attempt to employ these estimates to contribute to the literature on welfare regimes. Previous works looked only at private transfers (e.g., Albertini & Kohli, 2013; Albertini et al., 2007; Attias-Donfut et al., 2005; Mudrazija, 2014), while others also included public transfers for some specific age groups (Brandt & Deindl, 2013; Mudrazija, 2016). The limitation to particular age groups stems from the fact that these studies use SHARE data, which only covers populations aged 50 and more, meaning that the most important part of private transfers (i.e. transfers from parents to their young children) are neglected.
On the other hand, Saraceno and Keck’s (2010) measure private and public transfers covering all age groups. However, in contrast to Istenič et al. (2019), Saraceno and Keck’s (2010) analysis measures private transfers only indirectly, using indicators such as the amount of child allowances, the duration of maternity leaves, the minimum amount of non-contributory pensions, and the coverage offered by residential and home-care services. By doing so, they assume that in the countries where the state’s provision of welfare is small, families need to take care of the individuals. They conclude that country-specific policy profiles do not always coincide for young and old generations. Their results identify three groups of countries: those where public transfers do substitute private ones (high degree of de-familiarisation and high level of public support) towards both the young and old generations (e.g., Sweden and France); countries in the opposite extreme (a high degree of familiarisation also for both the young and old generations (e.g., Italy and Spain); and the largest group of countries, which show significant differences in the support provided to both age groups (e.g., Germany, the United Kingdom, Austria, and Hungary).
Istenič et al. (2019) is thus the first attempt to measure private and public transfers directly and comprehensively for all age groups. This was made possible by NTA data, allowing the authors to estimate the value of private intra-household transfers, which is one of the main contributions of the NTA. The authors exploit the National (Time) Transfer Accounts (NTTA) estimates to build five indicators that contribute to the understanding of the welfare state typology. The first two indicators start from the NTA profiles to measure the size of the protection towards the elderly and the children. The third indicator adds NTTA to measure the relative size of the monetary value of time transfers. The final two indicators measure the gender gap and the size of women’s independence, first by using only gender-specific NTA and secondly by combining gender-specific NTA and NTTA estimates. Istenič et al. (2019) ‘s main contribution is, therefore, providing a comprehensive measure of the degree of de-familiarisation. By measuring monetary and time family transfers along the life-cycle, they introduce what could be called a state–market–family nexus. Based on the analysis of 10 EU countries, the authors conclude that a clear connection between welfare regimes and transfer systems exists.
This paper extends the work presented by Istenič et al. (2019) by including additional disaggregation into the NTA results. On the one hand, this paper employs NTA results disaggregated by educational level. On the other hand, it provides additional information to the de-familiarisation score by including NTA estimates also disaggregated by family type.
Characteristics of the different welfare regimes
In a liberal welfare regime, the state encourages the market. It does so either actively by subsidising private welfare institutions (family and the markets) or passively by guaranteeing only a social minimum mainly to the low-income working class (Esping-Andersen, 1990, 1999). Even though liberal welfare states are characterised by little public support to the social care system, they have a high provision of health care (Stoy, 2014, p. 397) For care provision the risk is individualised (Esping-Andersen, 1990, 1999), meaning that wealthier individuals acquire care on the market, whereas the poor mainly rely on the family (Stoy, 2014). Concern about gender equality is low, and the family’s role is marginal (Esping-Andersen, 1990, 1999).
A social-democratic welfare regime promotes equality at the highest standards, including for members of the middle-class and is highly independent of individuals’ past contributions. To cover the enormous costs of maintaining universal social rights, full employment is promoted. The state crowds out the private sector more intensively than in other countries and takes a substantial part of the responsibility of caring for children from the family. In social-democratic welfare states, gender equality is highly promoted (Esping-Andersen, 1990, 1999).
Conservative or Continental welfare regime institutions follow the traditional norms of the Church. The state guarantees social rights conditional upon past employment contributions. The traditional family is emphasised, and family benefits extensively support motherhood (Esping-Andersen, 1990, 1999). Additionally, in European settings, Mediterranean countries can be distinguished from the conservative welfare regime. In the Mediterranean countries, smaller institutional development leads to a lack of an articulated social minimum, with large gaps in protection. The peak of generosity comes in old age. One of the Mediterranean welfare regime’s main features is the extended role of the family (Ferrera, 1996; Esping-Andersen, 1999).
Disaggregated NTA data
The analysis presented here uses new NTA estimates by educational level and family type developed in the WELTRANSIM project. Three levels of education are distinguished: Low (ISCED 0-2), Medium (ISCED 3-4), and High (ISCED 5+). Family types are constructed according to partnership status and the presence of dependent children in the family (up to age 59) and childlessness (for ages 60+). Dependent children are children up to age 16 and students up to 25 if living with parents.
Figure 1: NTA age profiles of labour income and consumption. Simulation output based on NTA data by education and family type developed in the WELTRANSIM project
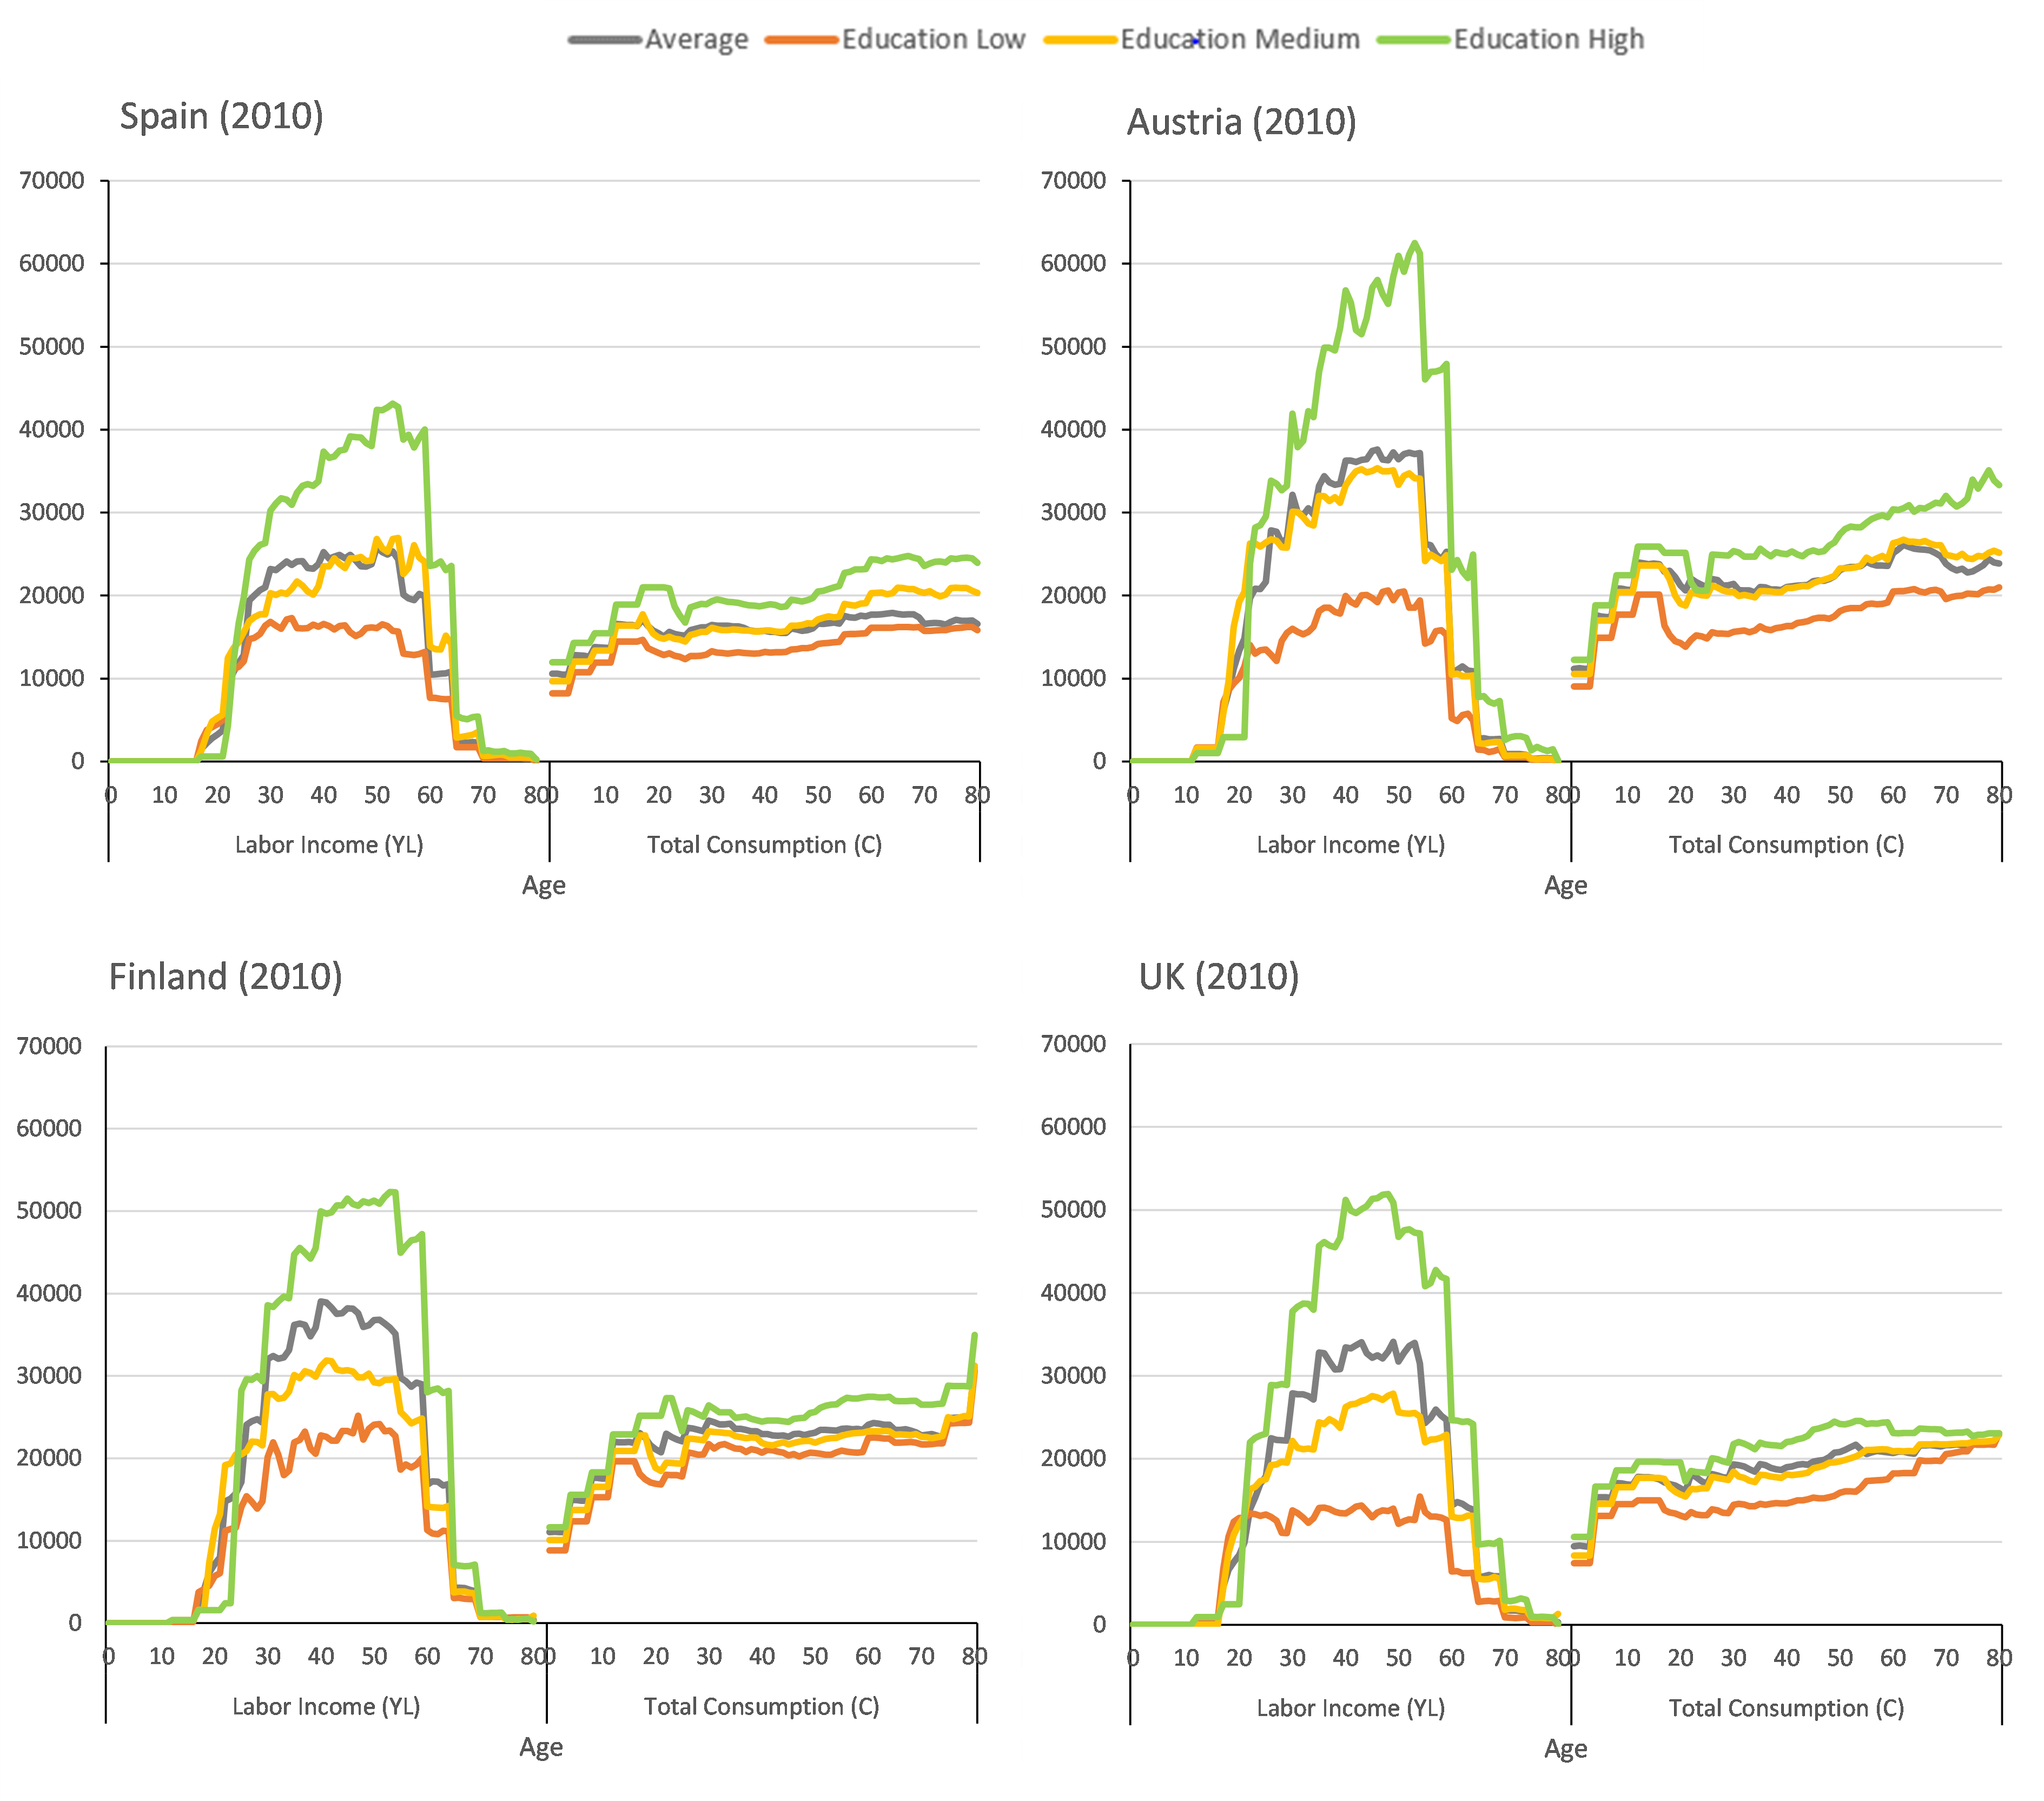
Note: data expressed in € per capita in the year 2010
Figure 1 illustrates the NTA age profiles of labour income and total consumption by education (for children and students up to 25, education refers to parents’ education). Labour income has a typical inverted U-shaped distribution, with labour income being concentrated during working ages. In all the countries, the higher educated earn much more than medium-educated, followed by earnings of low-educated. High-educated people reach higher incomes, especially later in their work career, and they remain in the labour market until a higher age. In contrast to labour income, total (public and private) consumption is relatively constant at all ages.
Figure 1 reveals that the welfare state enables that consumption differences are much smaller among individuals with different levels of education than the differences in the labour income. This is partially due to tax progressivity and to the fact that public consumption “crowds in” the private consumption along the individuals’ life-cycle. At the age of 40, when individuals are in the middle of their most active working period, high-educated people in Spain earn 2.25 more than low-educated. The corresponding value is 2.85 in Austria, 1.53 in Finland and 3.82 in the UK. In contrast, the high-educated consume 1.43 more than the low educated in Spain – 1.53, 1.18, and 1.51 more in Austria, Finland, and the UK. It follows, that the ratio between consumption and labour income for the high-educated with respect to the low-educated accounts for 1.58, 1.85, 1.85, and 2.50 in Spain, Austria, Finland, and the UK, respectively. These values generally follow the welfare state typology with Austria - and especially Finland - being the countries with a more redistributive welfare system than Spain. The only exception is the UK, where the value is smaller than expected. Furthermore, the figure reveals that the difference in labour income between low and medium-educated is the smallest in Finland, which appears to be in line with a generous welfare state in the social-democratic country.
The difference between labour income and consumption results from transfers – both private and public – and asset reallocations (asset income minus dissaving). Figure 2 depicts the age profiles of private and public net transfers by education.
In all the analysed countries, the young are on average net receivers of both public and private transfers, whereas individuals are net payers of transfers during prime working ages. While the elderly are at high extent net receivers of public transfers, their net private transfers are negligible. A comparison between the transfers in the four countries reveals similar patterns and absolute magnitudes (in €) for family transfers in Spain, Austria and Finland. On the other hand, the UK shows lower values, especially for the high-educated: the youth aged 15-25 in high-educated families receive considerably less family transfers in the UK than in the other countries and, in parallel, high-educated workers between 25-50 also give less private transfers. Regarding public transfers, similar patterns are observed again, although Austria and Finland show higher absolute values, especially for the high-educated. In the UK, the low-educated group present an almost zero profile of net public transfers for ages 20-50 (they are not net payers nor recipients). In contrast, in the remaining countries, the profile is negative at least during a period inside that age range.
Figure 2: NTA age profiles of public and private net transfers. Simulation output based on NTA data by education and family type developed in the WELTRANSIM project
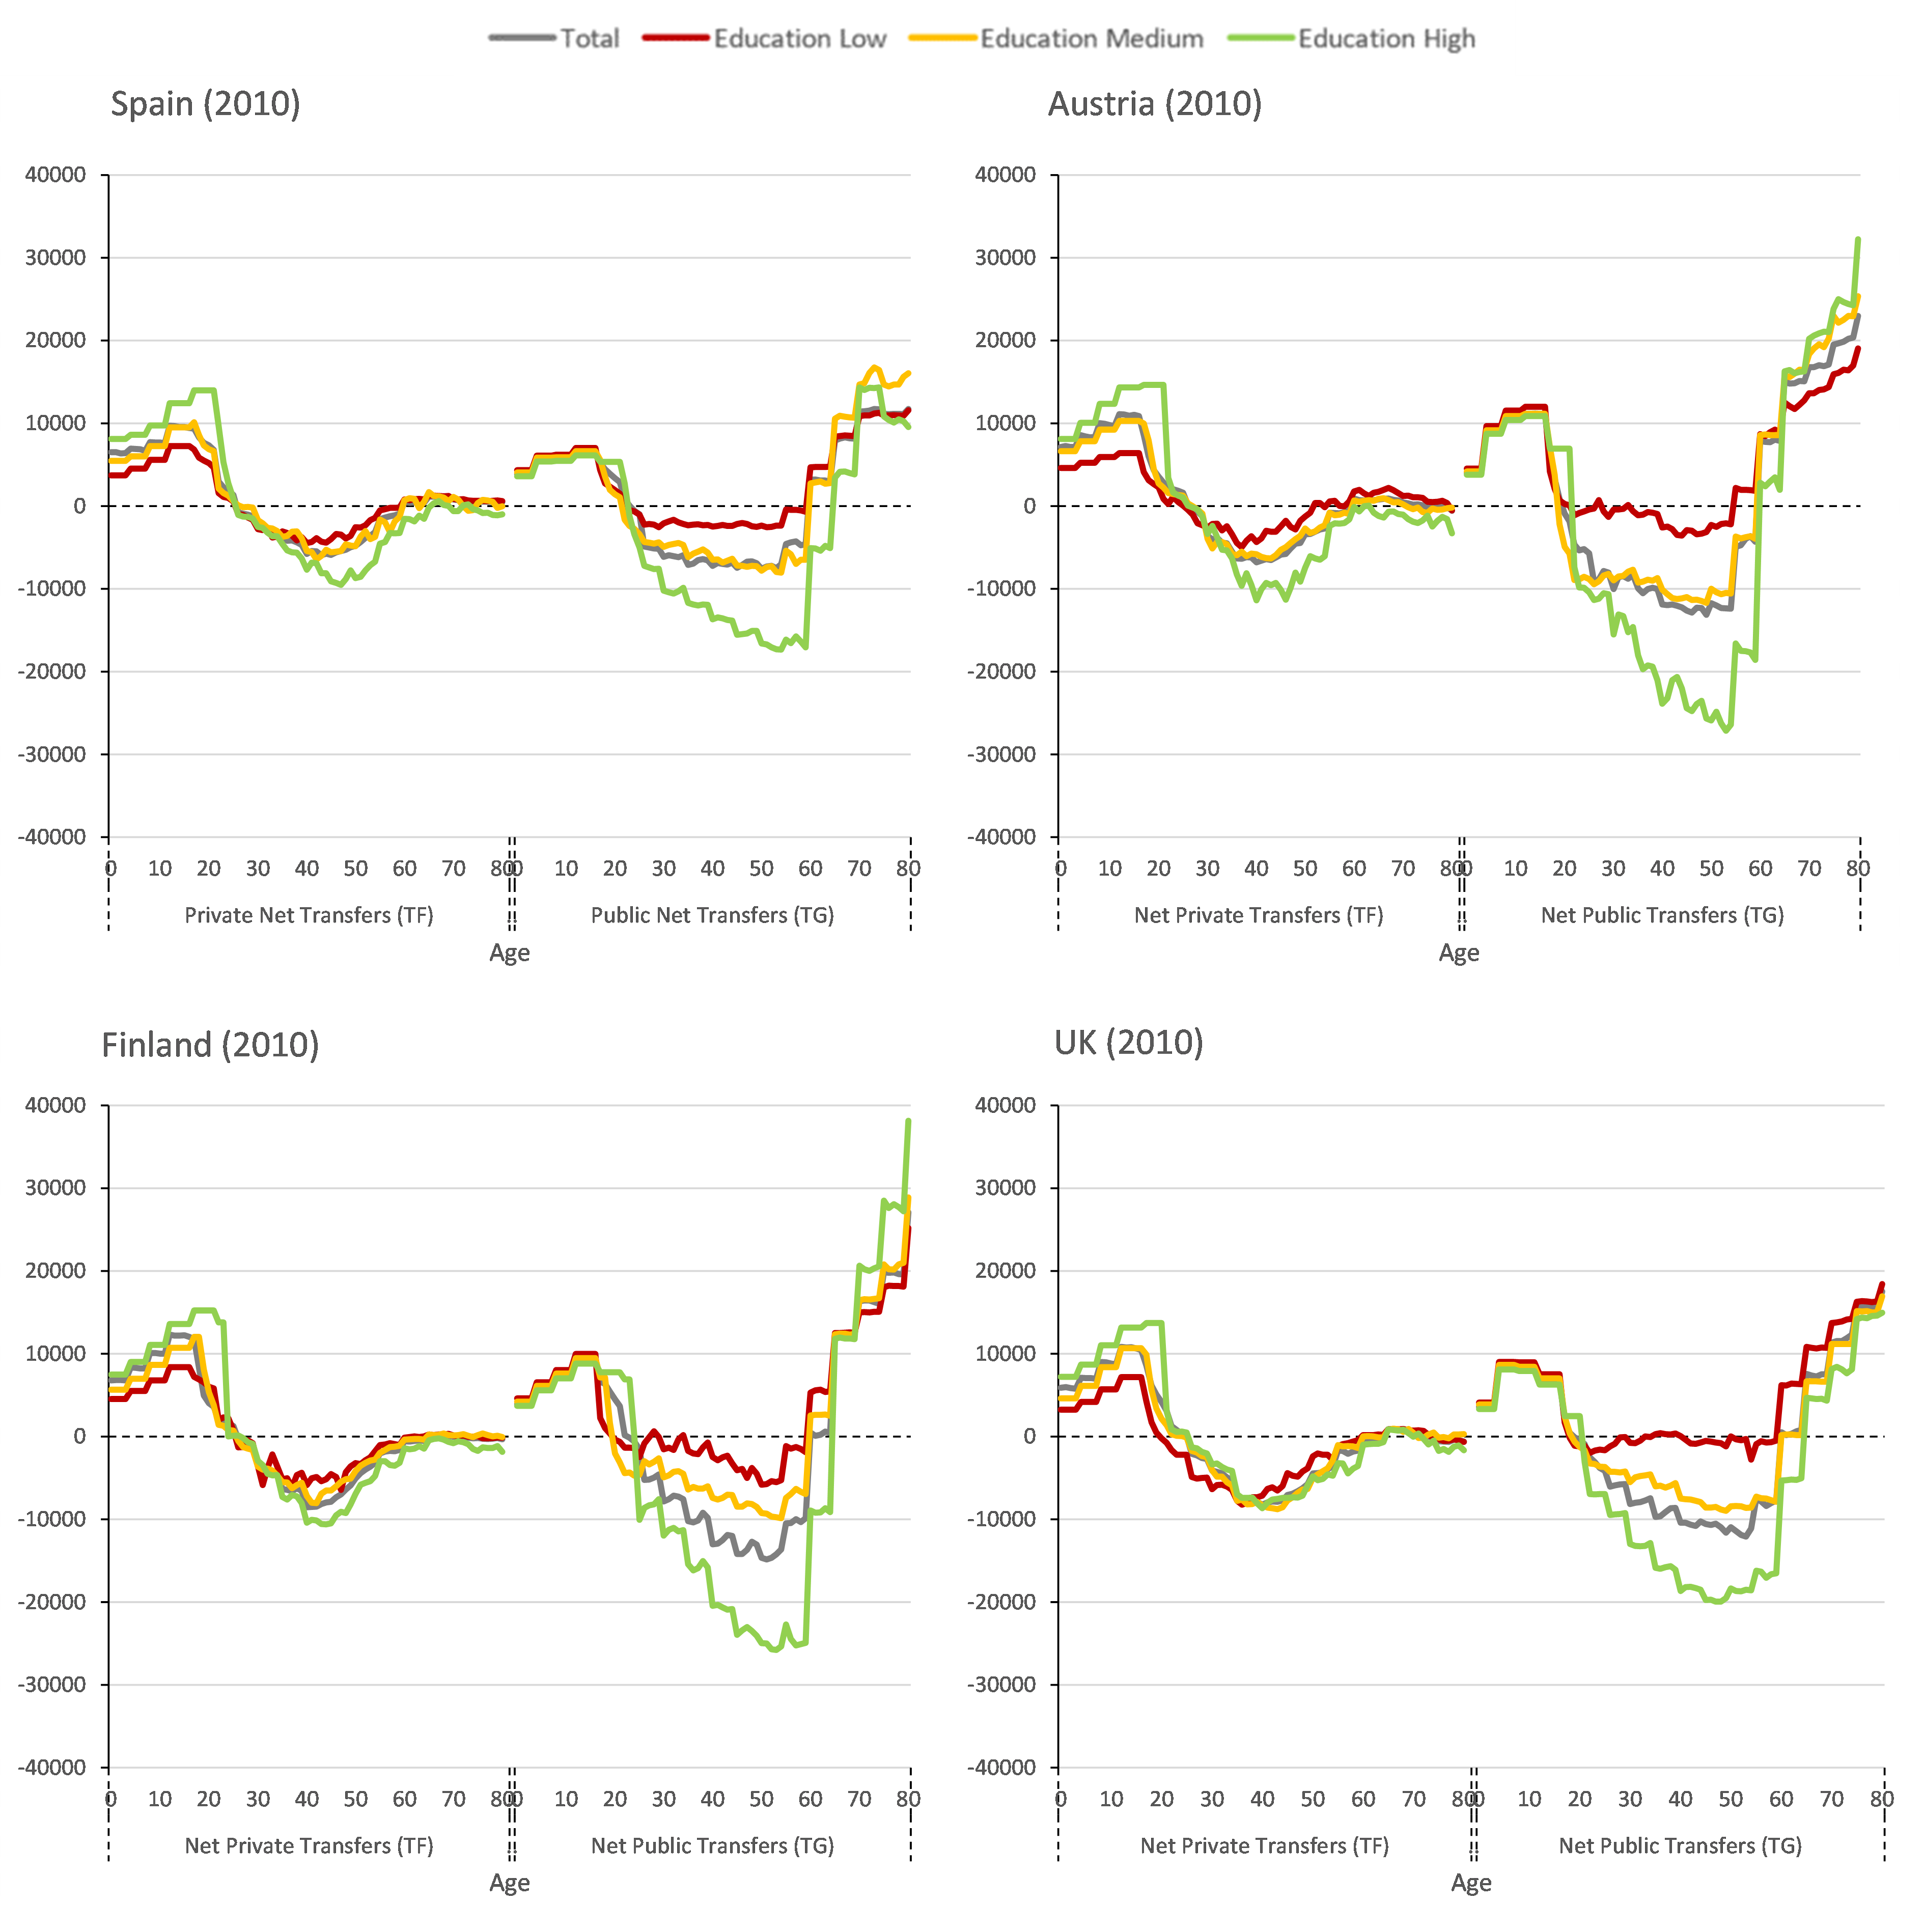
Note: data expressed in € per capita in the year 2010
Furthermore, looking at the average value of private transfers reveals that private transfers stay high until relatively higher ages in Spain as compared to other countries. This resembles an extended role of the family in the Mediterranean countries. While in Spain positive net private transfers start to decrease sharply only at the age of 22, this decrease happens much earlier in Austria (at age 17), Finland and the UK (both at age 18). The differences in redistribution through public transfers are even higher than through private transfers. The public welfare provision for the elderly is most visible in Austria and Finland, and smaller in Spain and the UK. This is in line with the previous literature connecting welfare regimes and transfer systems (see, for example, Istenič et al., 2019).
Results on intra and intergenerational income redistribution
In the following, the approach developed in Lee et al. (2017) for studying the intergenerational dimension of both family and public transfers is used. Besides the NTA profiles and demographic projections, this approach requires an assumption on economic growth, to project future transfer receipts and tax payments, and an appropriate discount factor to value future flows in the present. Like in the original study, we use a discount factor of 3% and set the annual economic growth rate to 1.5%. Before applying adjustments to balance the budget, all incomes and transfers are assumed to grow at the same rate. (By using a constant adjustment to growth, we might be overstating future pension rights, as pensions are not fully adjusted to wage growth.)
Figure 3 depicts the net present value (NPV) of net public transfers at birth, which is equivalent, with the opposite sign, to the Generational Account (net taxes) of the representative individual of future generations – born right after the base year. Without adjustments of taxes and benefits for balancing budgets, the NPV of public transfers is positive in the four countries, meaning that, on average, individuals are net receivers of public transfers. The average value amounts to 16% of the present value (PV) of the labour income of a cohort in Spain, 14% in Austria and Finland, and reduces to 11% in the UK. For the 2011 birth cohort, disaggregation of NTAs has different effects in the four countries. In Finland, the PV of public transfers slightly increases, while it declines in the rest, which different intensity: low change in Austria, a one-third reduction in Spain, while becoming zero in the UK. Calculating the NPV by education group, interesting differences among countries can be found. As expected, low-educated present the biggest PV of net public transfers in all cases, although the amount is notably lower in Spain. In the case of medium educated, Spain and Austria show the same value, clearly below Finland, but higher than in the UK. Finally, for highly educated, Austria and Finland show a positive PV of public transfers, while it is negative for Spain and the UK. These results are in line with the welfare literature, stating that in the liberal countries (as the UK) the government takes responsibility primarily to those with lower income, whereas in social-democratic countries (as Finland) rights are universal. Furthermore, results indicate that in continental countries (as Austria), social rights are conditional upon past contributions, resulting in positive net public transfers for the higher educated.
In the next step, all transfers are adjusted in a way that balances the budget each year. As in Lee et al. (2017), the assumption is a symmetric adjustment; i.e., to prevent a deficit, taxes are increased to the same extent as benefits are reduced. After this adjustment, both based on aggregated or disaggregated NTA data, the NPV of lifetime public transfers received by the 2011 birth cohort is close to zero in Austria, Spain, and the UK and it turns negative for the 2040 birth cohort in the first two, while remains near zero in the UK. In Finland, however, the PV of lifetime public transfers received is negative with both aggregated and disaggregated NTA data, and the negative amount increases significantly for the 2040 birth cohort. Again, there is a strong education gradient.
Figure 3: Net Present Value (NPV) of public transfers
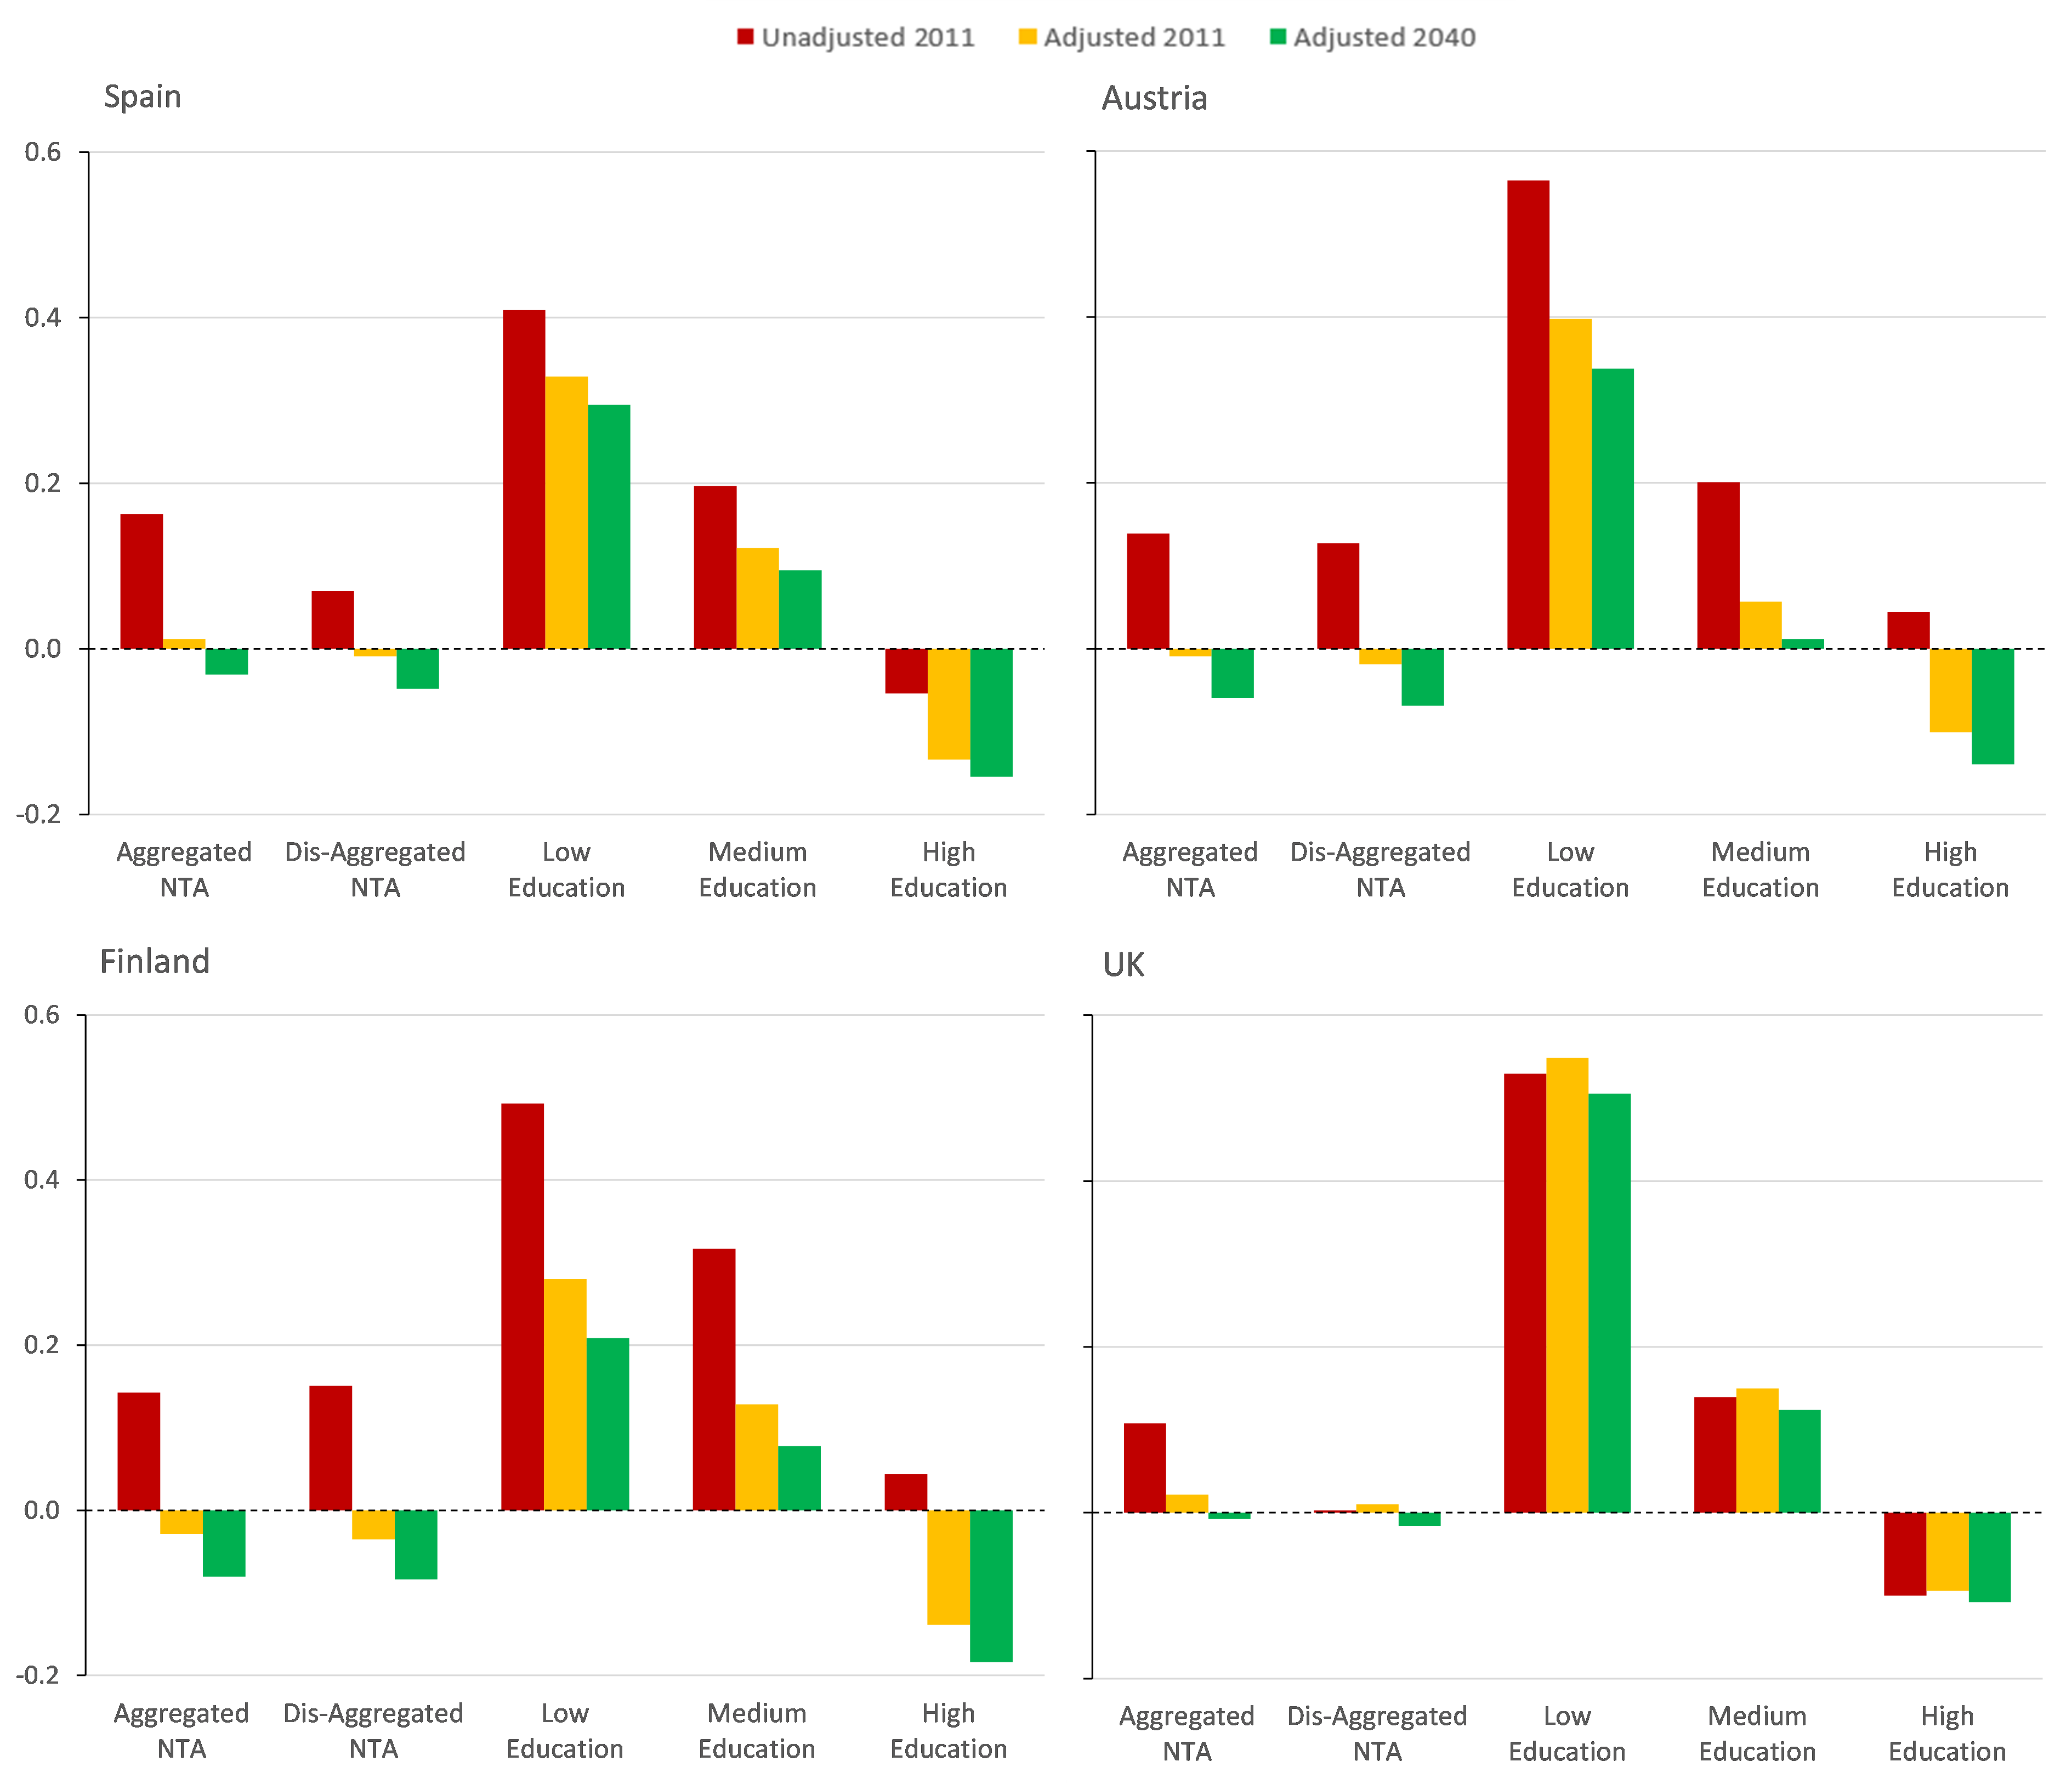
Note: Net present value (NPV) at birth of lifetime public transfers as proportion of the present value of lifetime labour income – W/O balancing budgets.
As explained above, Lee et al. (2017) extend the analysis of the Generational Accounts (or NPV of public transfers) also to private transfers (TF). Consistent with their findings (for the US and Taiwan), the NPV of private transfers in Austria and Spain is – and stays – positive for future cohorts; thus, each cohort privately receives more than it gives. This is true even in the case when TF are adjusted in the future to close the gap between future needs and transfers.
Figure 4: Net present value of public, private and total transfers by birth cohort
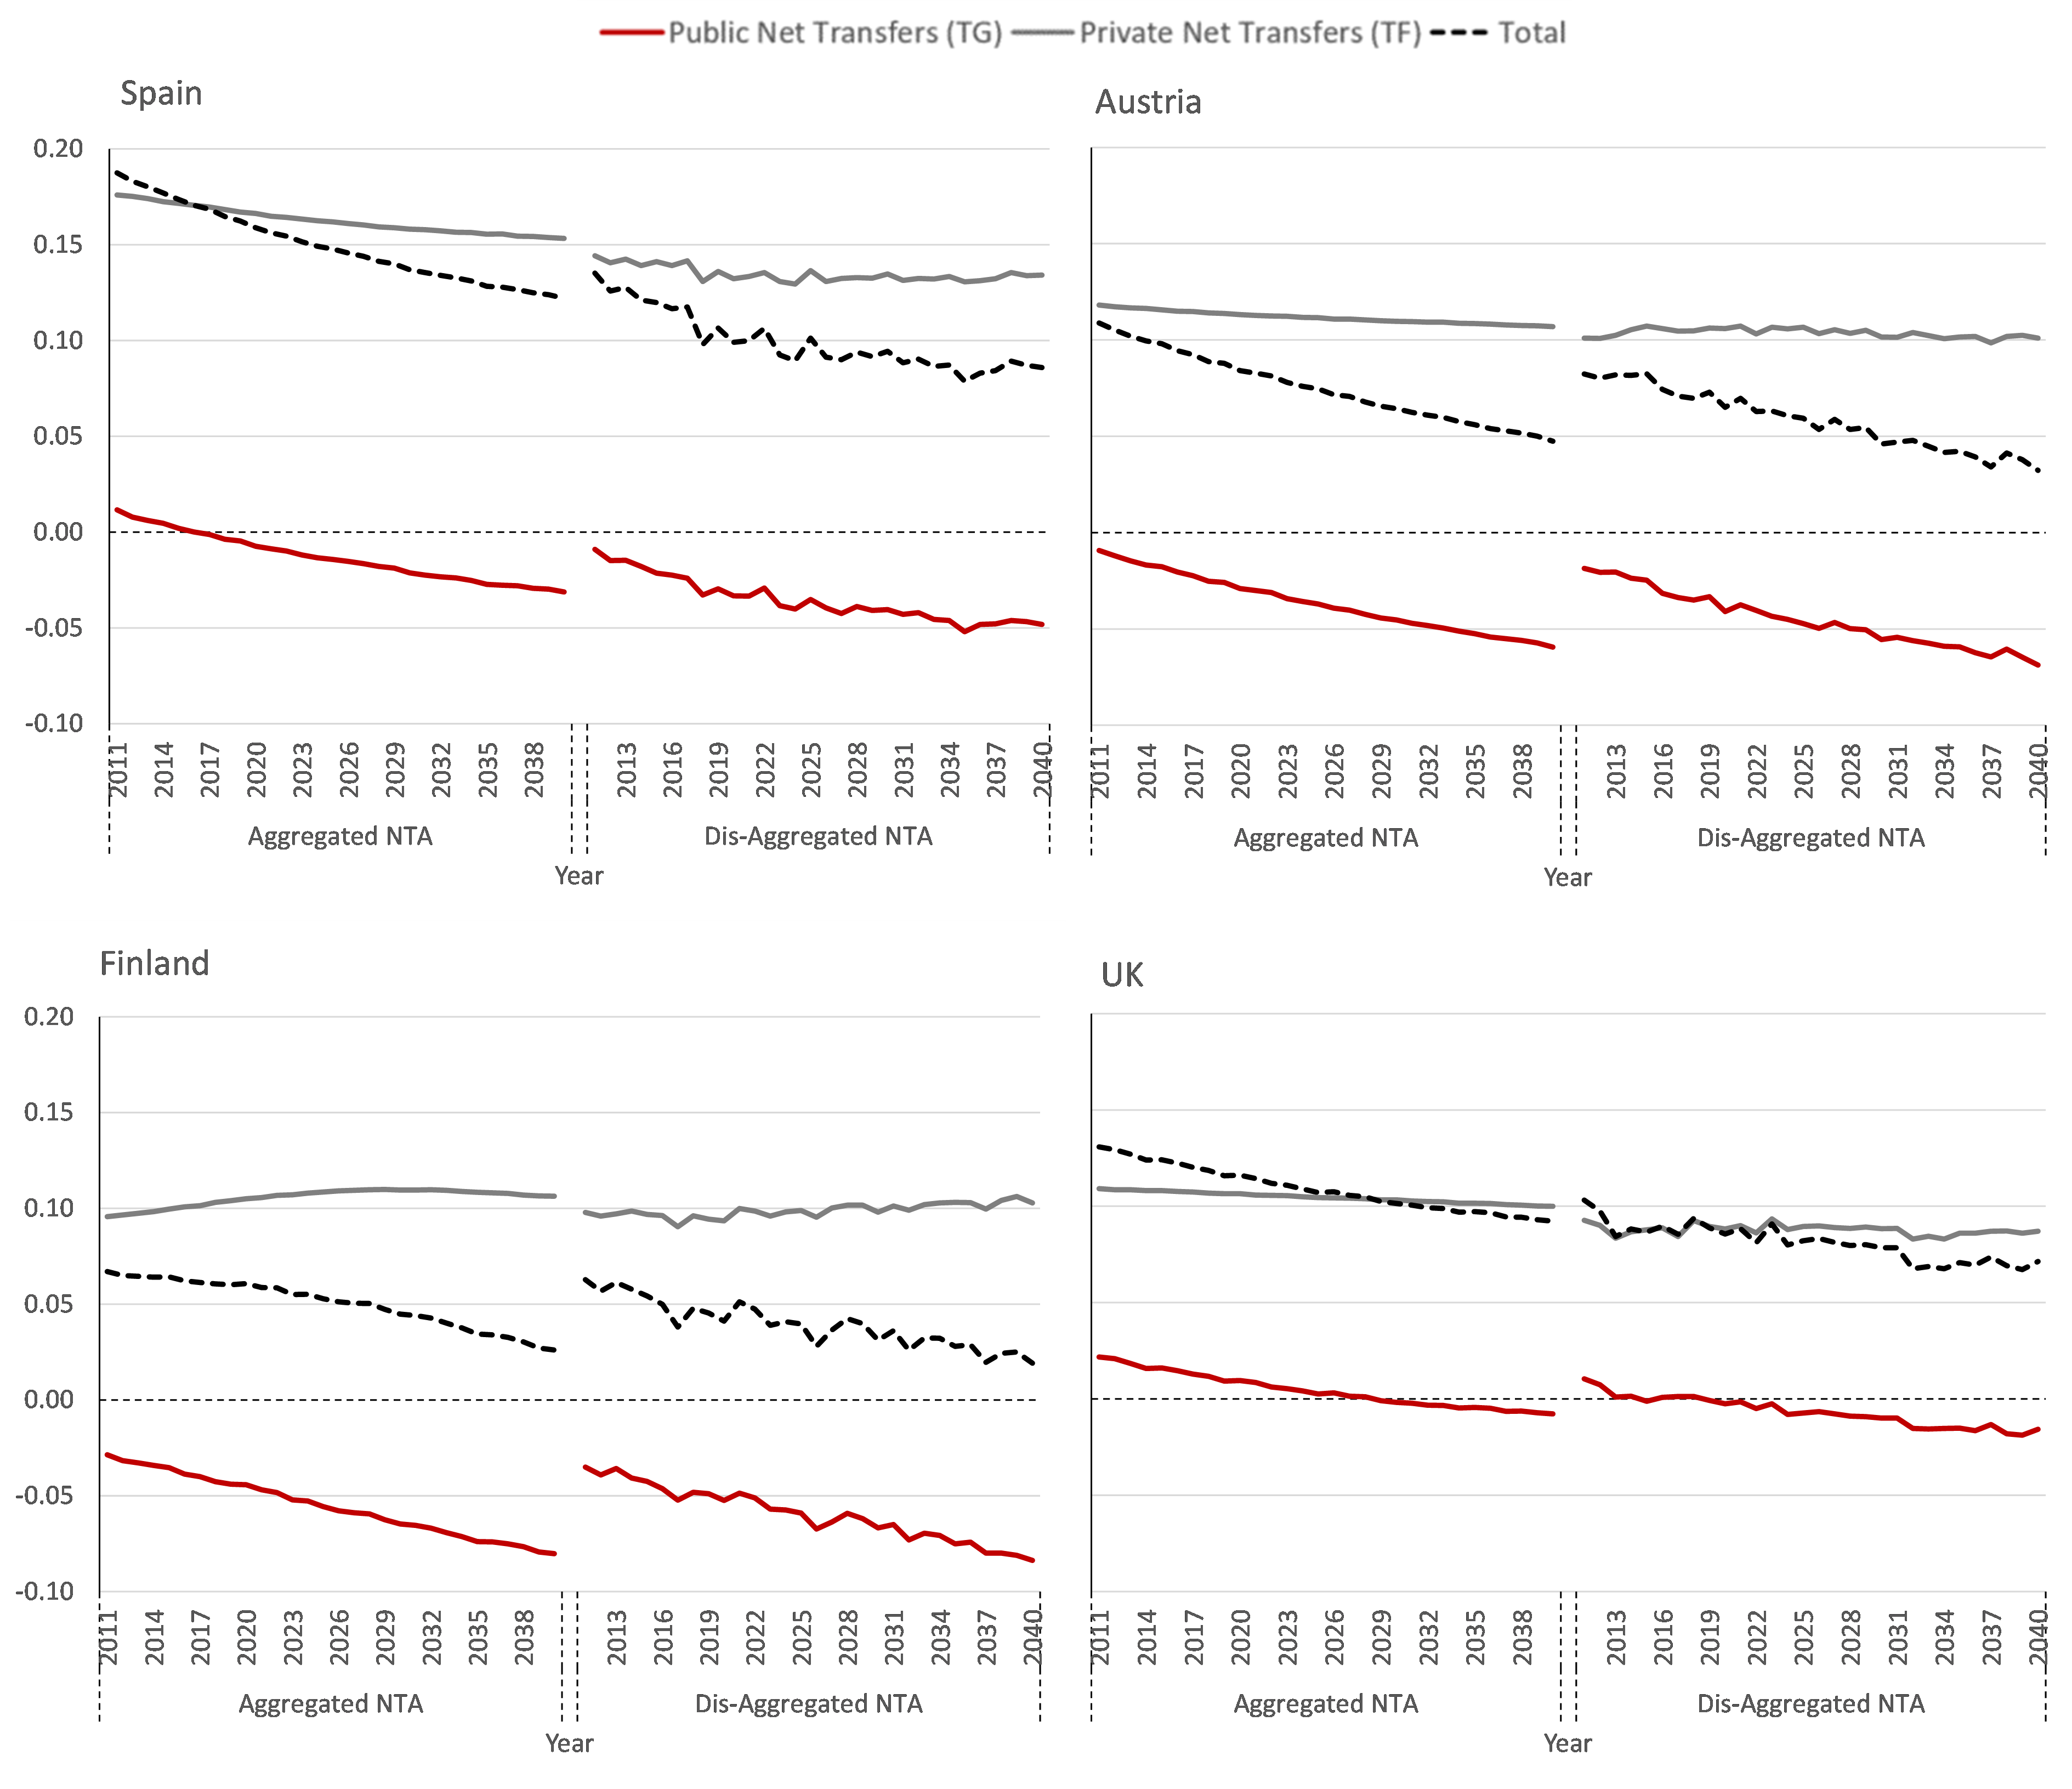
Note: Net present value at birth of lifetime of public, private and total transfers as proportion of the present value of lifetime labour income.
Figure 4 depicts, by birth cohorts, the NPVs of the (adjusted) public and private transfers, as well as total transfers. Based on aggregated NTA data, the NPVs of total transfers – while decreasing over time – stay positive, indicating that, when accounting for private transfers, also future cohorts receive more than they give over life. Recall that the age shape of private transfers (see Figure 2) implies that transfers mainly go from parents in working-age to young children. On the contrary, the adjusted value of average public transfers starts being negative in Austria and Finland, while positive in the other two countries. Nevertheless, in all cases, it decreases steadily, although with particular intensity in Finland and Austria. In the UK, it remains no far from zero for the last cohort, born in 2040. The decrease is even more pronounced in case of disaggregated NTA.
Figure 5: Net present value of public, private and total transfers by birth cohort and education
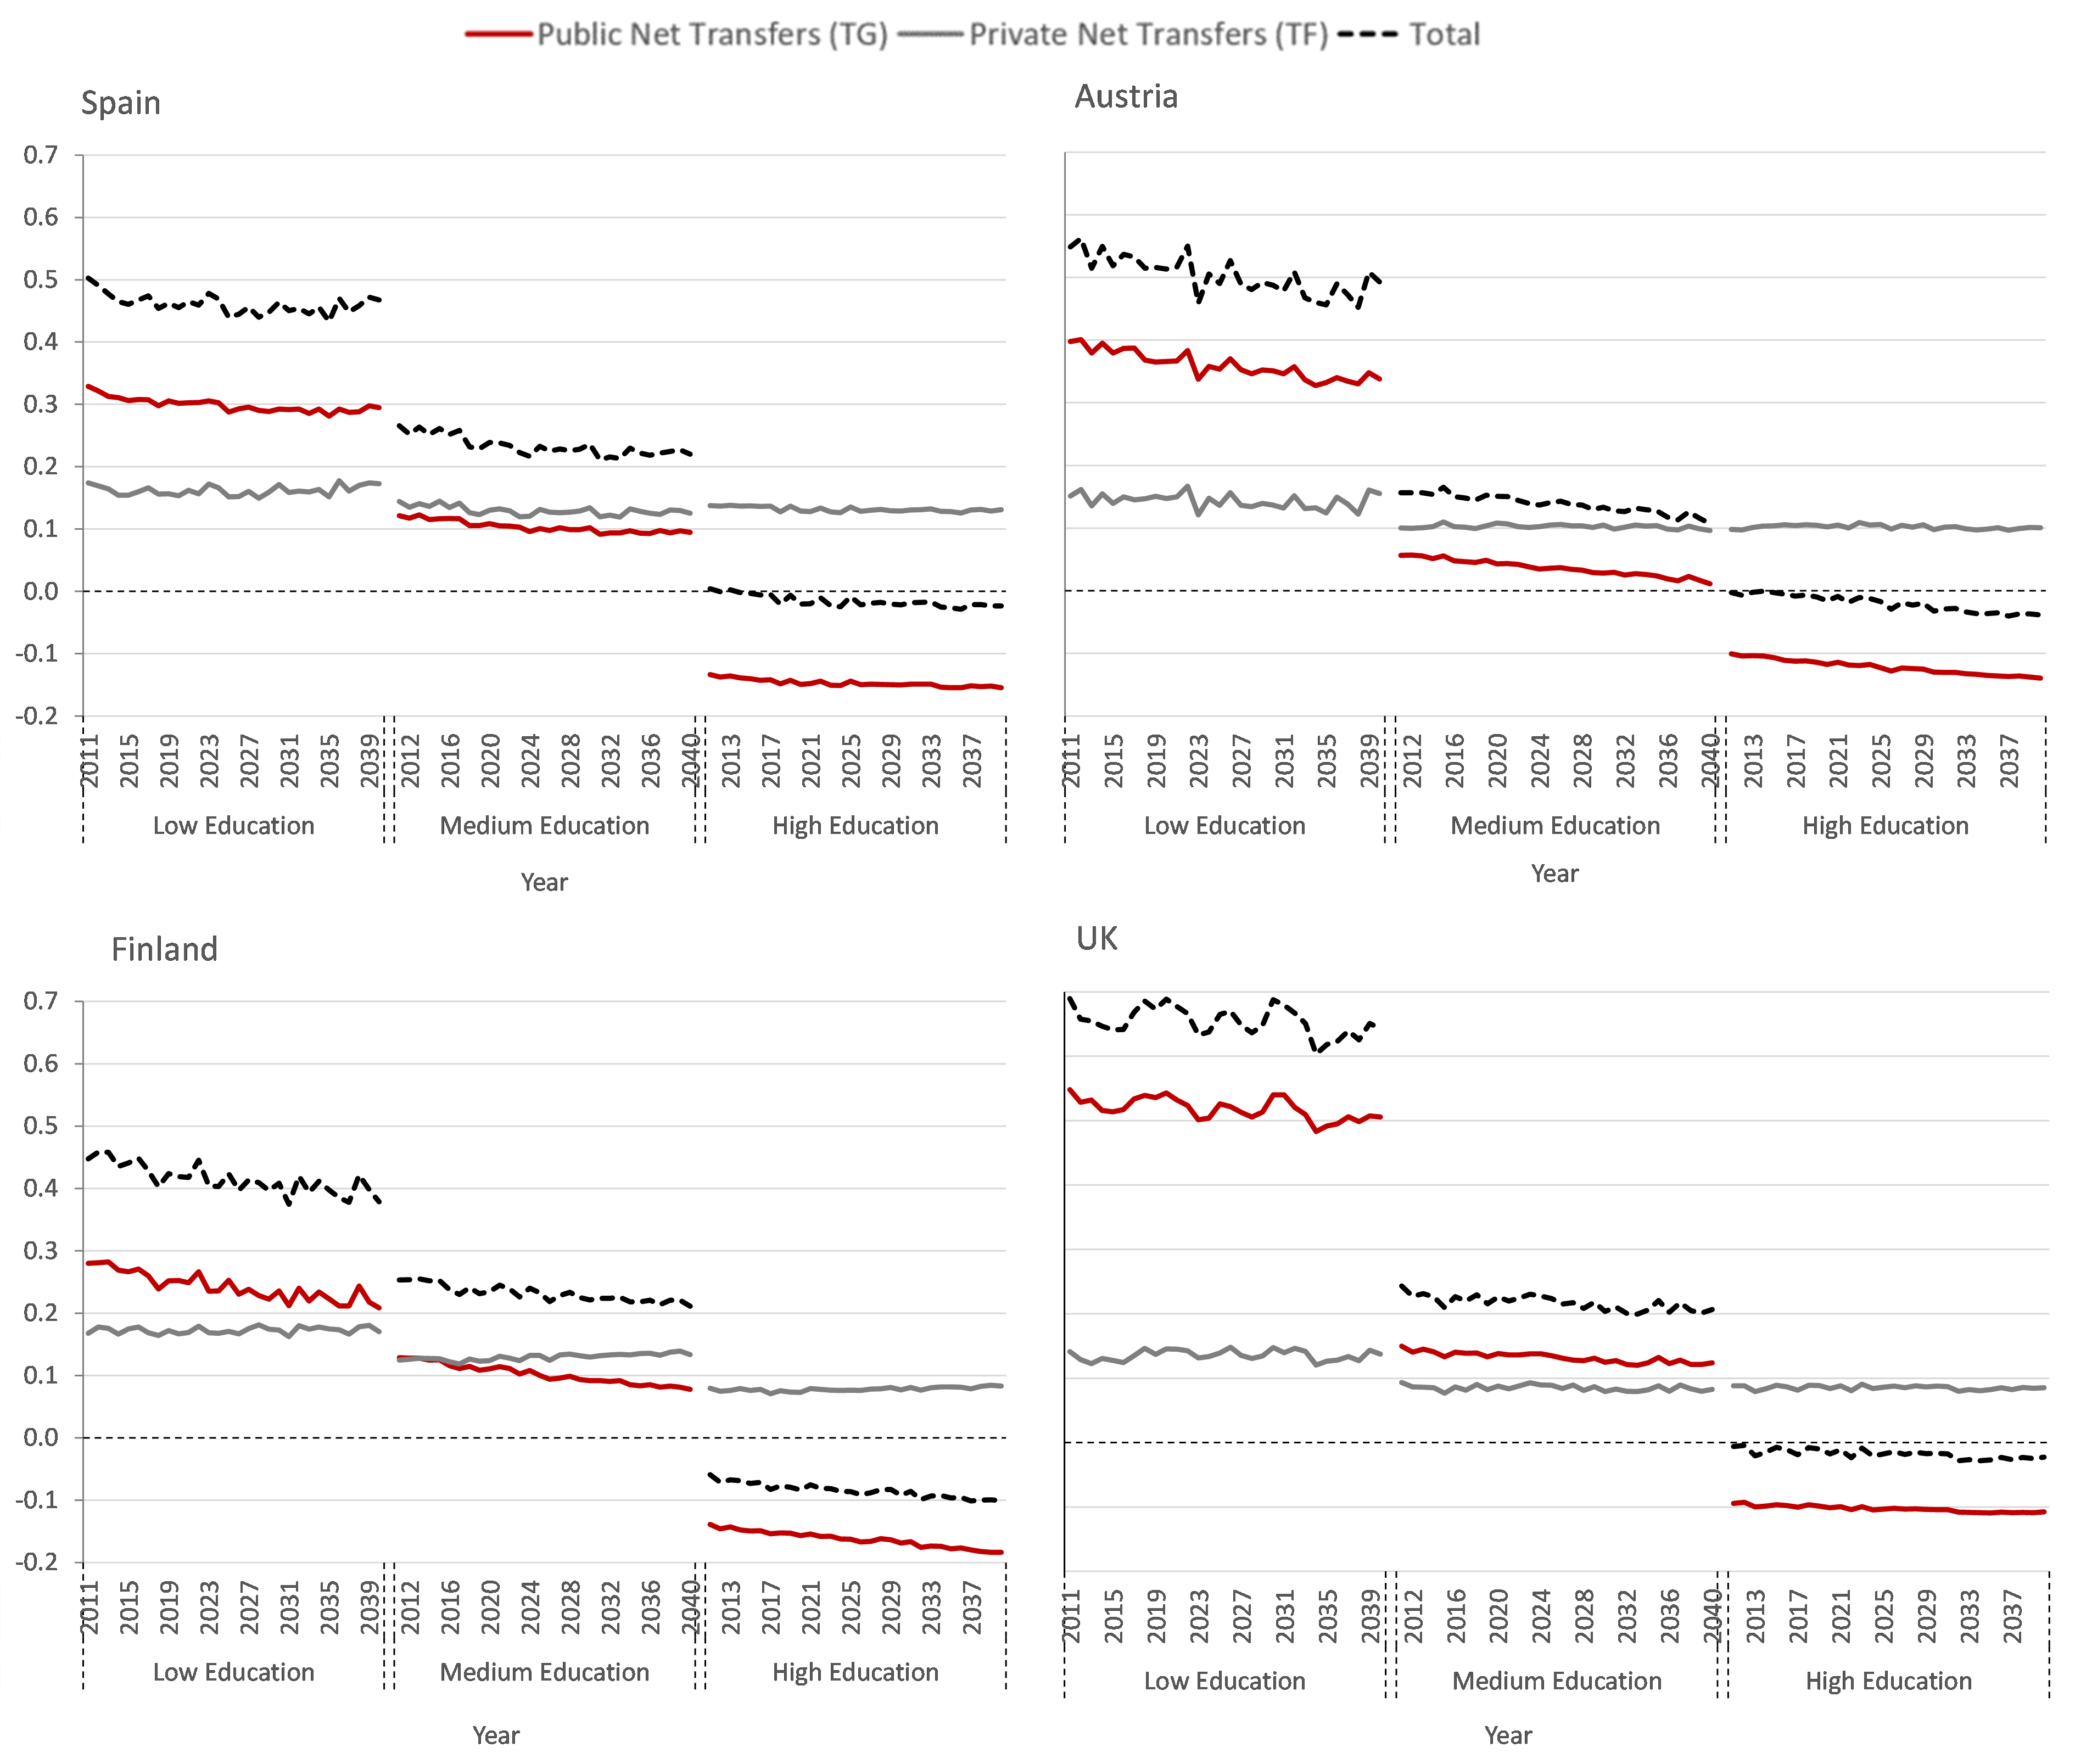
Note: Net present value at birth of lifetime of public, private and total transfers as proportion of the present value of lifetime labour income.
Figure 5 shows the same measures distinguishing by education level. As already seen in Figure 3, the initial values for cohorts born in 2011 differ substantially by education level. For public transfers, the higher educated received a maximum of over 60% in the UK, 40% in Austria, 30% in Spain and a bit less in Finland. For the lower educated, public transfers for the same cohort are always negative, and much more similar (-15% in Finland and Spain, while -10% in Austria and UK). These differences persist over time, except in the UK, where they tend to remain at a similar level. In Austria, public transfers for the medium education level become almost negative for the last cohort, while in the rest of the countries remains clearly positive. Interestingly, the adjustment of private transfers is more limited: first, because of their shape, being strongly positive for the old, which is the age group growing most; and secondly, because families necessarily need to balance their budgets.
Figure 6: The effect of mortality differences by education on the net present value of public transfers
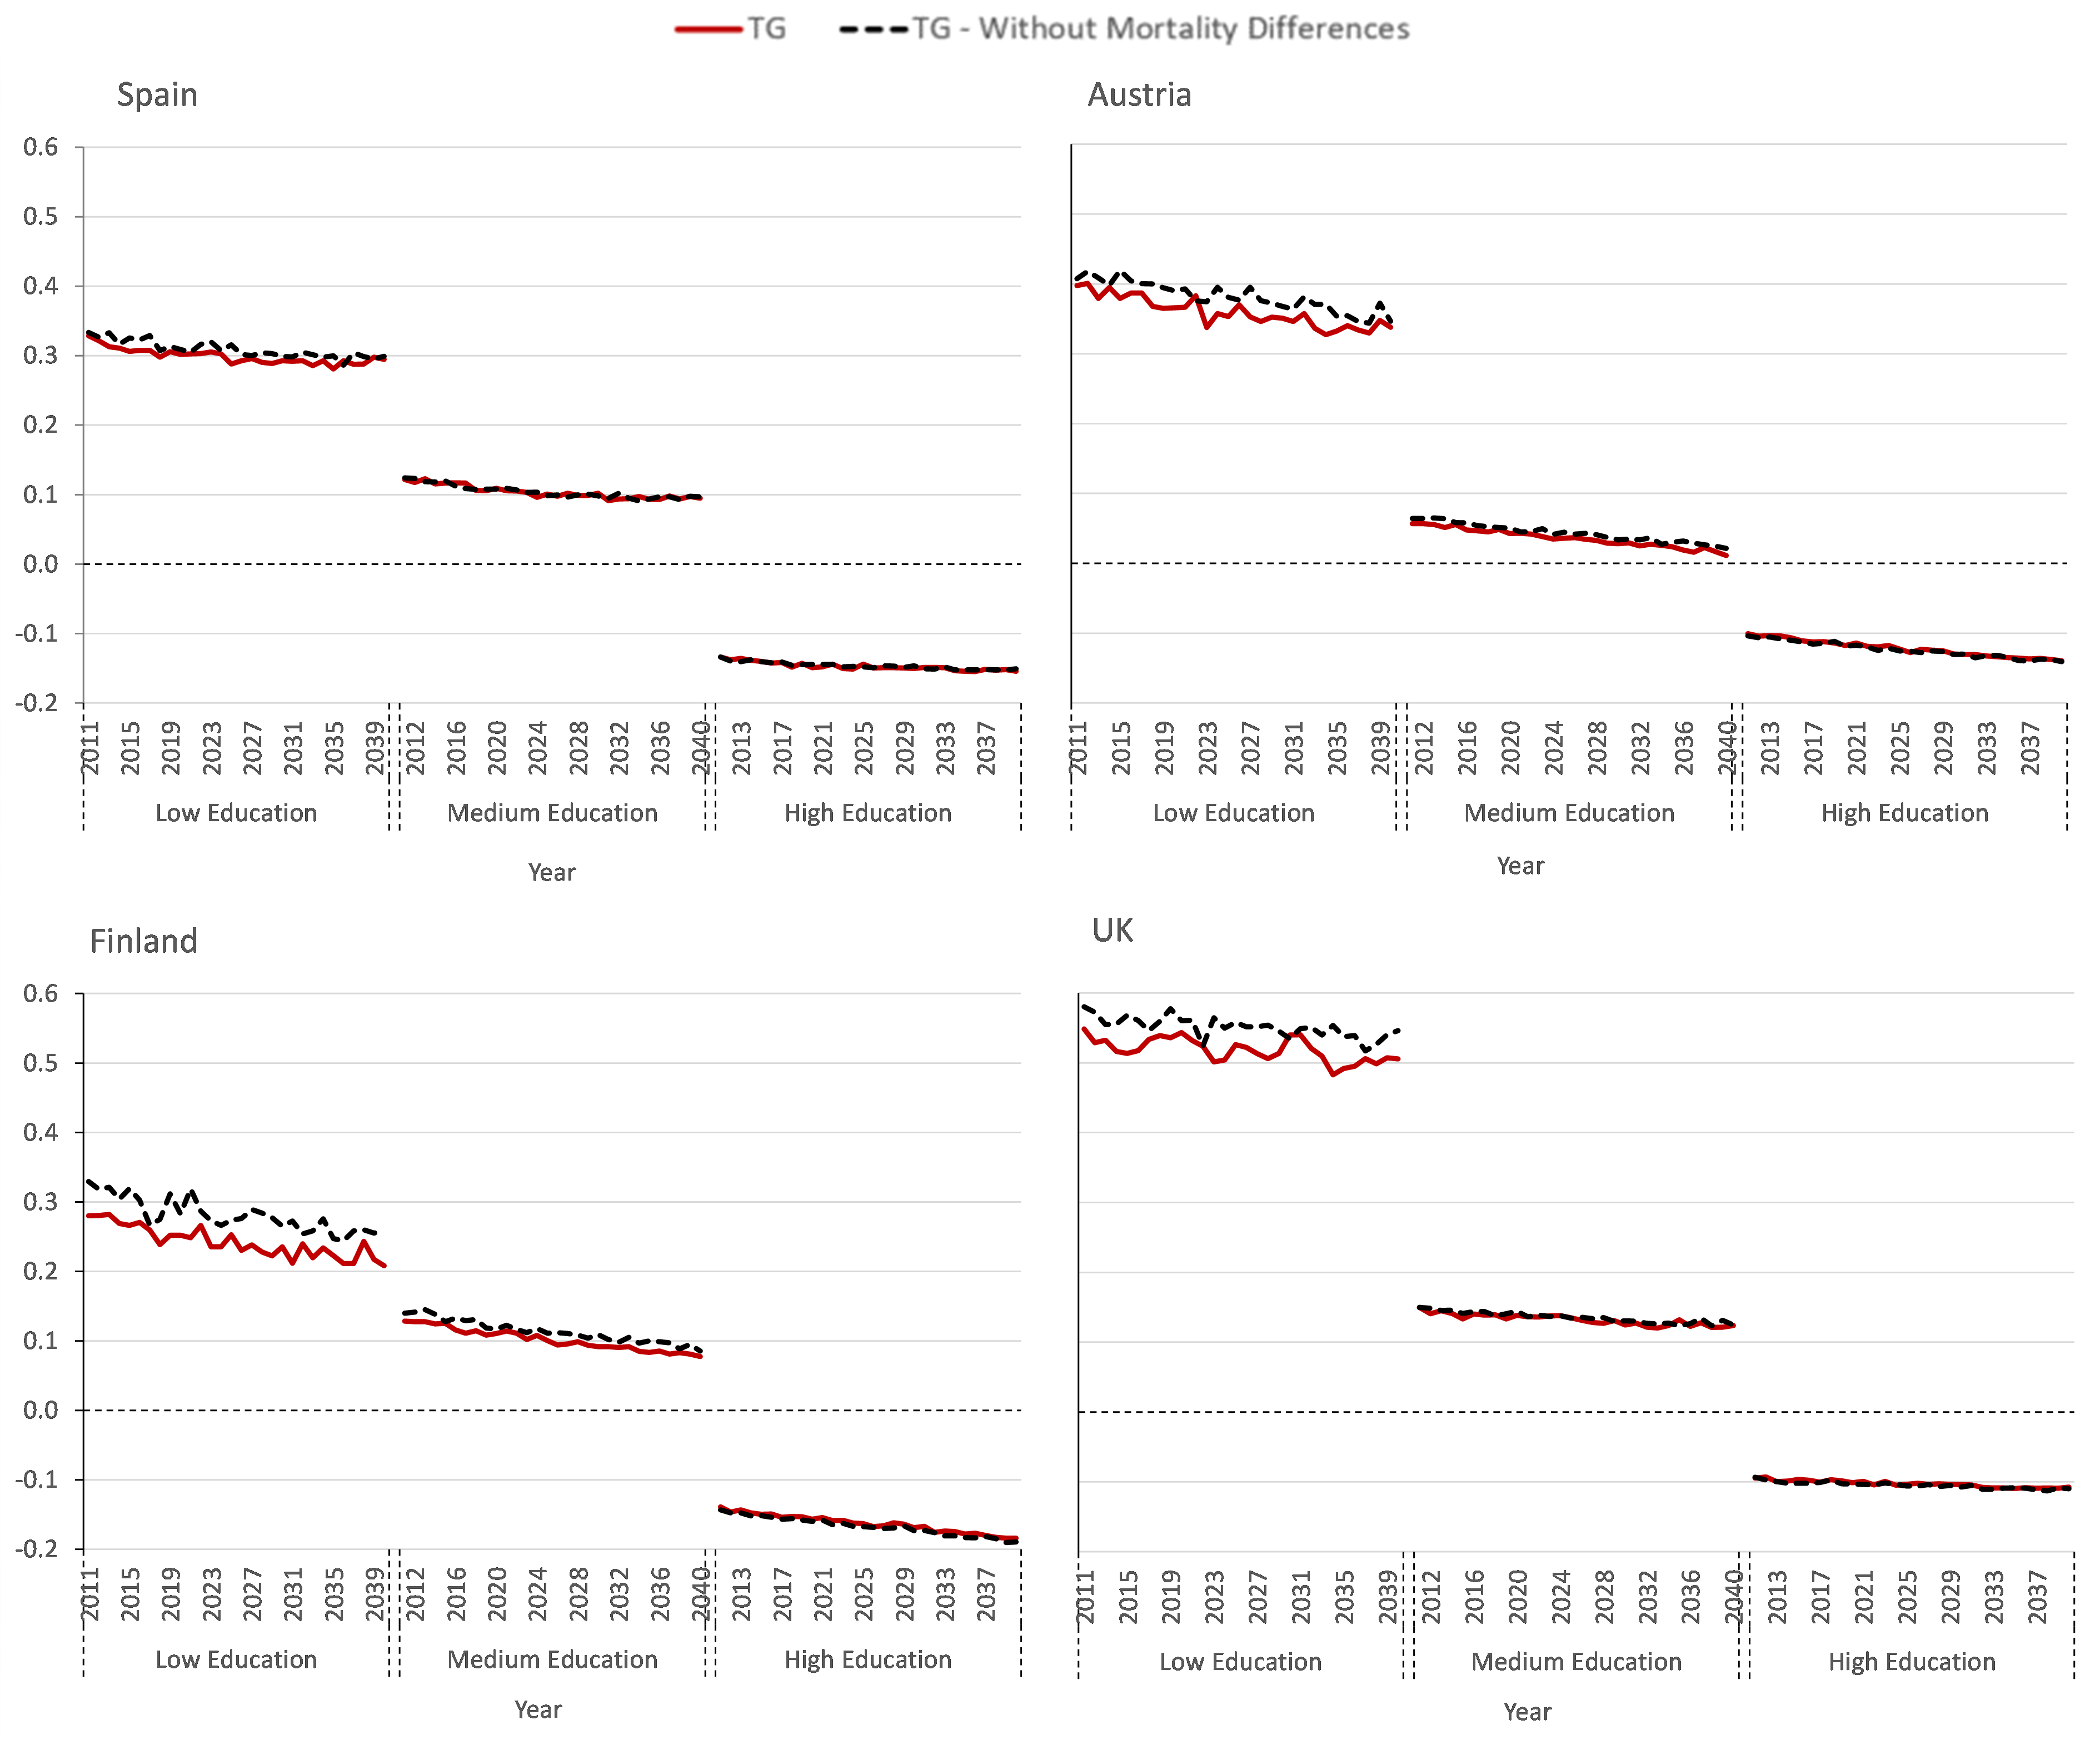
Note: Net present value at birth of lifetime public transfers as proportion of the present value of lifetime labour income – W/O mortality differences by education.
In the presence of mortality differentials by the level of education (Figure 6), an increase in average pensions is expected, since those with higher pensions, on average, live longer. Consequently, a higher adjustment of public transfers is required to balance budgets, which negatively affects all education groups. For the less educated, both their shorter life and the required additional adjustments have a negative impact on their NPV of public transfers. For the high education group, longer lives and additional adjustments have opposite effects. Running a scenario without mortality differences shows that effects cancel out in the high education group. In contrast, the low educated group loses, especially in Finland and the UK more than 2% of the PV of their lifetime labour income.
The next Figures (Figure 7 and Figure 8) show the present value of public (TG) and private (TF) transfers by gender, level of education and family type, in particular differentiating between parents and non-parents. Figure 7 presents absolute values, and it also displays labour income (YL), which will be used in Figure 8 to present TG and TF in relative terms. As expected, labour income increases with education, and it is higher for males. The four countries present a gender gap whatever the educational level or the parenthood status. Interestingly, the gender gap is always larger for parents, especially in Austria and the UK. This results from the traditional family norms emphasised in Austria and the low concern about gender equality in liberal welfare states. On the opposite, the lowest gender gaps can be seen in Finland and Spain for non-parents.
Moreover, in all four countries, fathers have a higher labour income than childless men at each level of education. The opposite occurs to women, probably due to their lower labour force participation: mothers at any level of education have less labour income than childless female. UK and Finland present the highest differences by parenthood status for males. For females, Austria presents the most considerable difference, while Finland the lowest. This can be again explained by the traditional role of families in conservative countries, whereas in social-democratic countries, the state takes responsibility for children at a greater extent, promoting full employment.
Regarding transfers, both Figures 7 (absolute terms) and 8 (in relation to labour income) show that the importance of TG and TF varies across countries. In Austria, both are practically the same, representing around 13% of the present value of the labour income. In Finland, however, public transfers are considerably higher than private (15% vs 9 %, respectively). Finally, in the other two countries, the situation is just the opposite: in Spain, the present value of public transfers results less than half the private’s (6% vs 16%) while in the UK private transfers represent 8% of the YL, and the public are near zero. Our results clearly show the North-South gradient of the welfare states. In Mediterranean countries, the dependent relies more on private transfers than public transfers, whereas in social-democratic countries, just the opposite is the case.
As far as for public transfers, it is worth mentioning that low and medium educated are net recipients. However, for highly educated, there is a gender difference: females are net recipients while males are net payers. Looking at the absolute values shown in Figure 7, it is observed that, overall, mothers receive more TG than childless women, the amount being especially high in Austria and Finland. In Spain, however, childless women receive slightly more than mothers, although the amounts are low in any case. Almost the same picture appears when looking at the results relative to the labour income for the same group (Figure 8): in Spain, there is a very slight difference between the TG received by mothers and childless women. This is a particularly interesting feature, revealing the weakness of family policies in this country.
Figure 7: Present value of labour income (YL) and net present value of private (TF) and public transfers (TG)
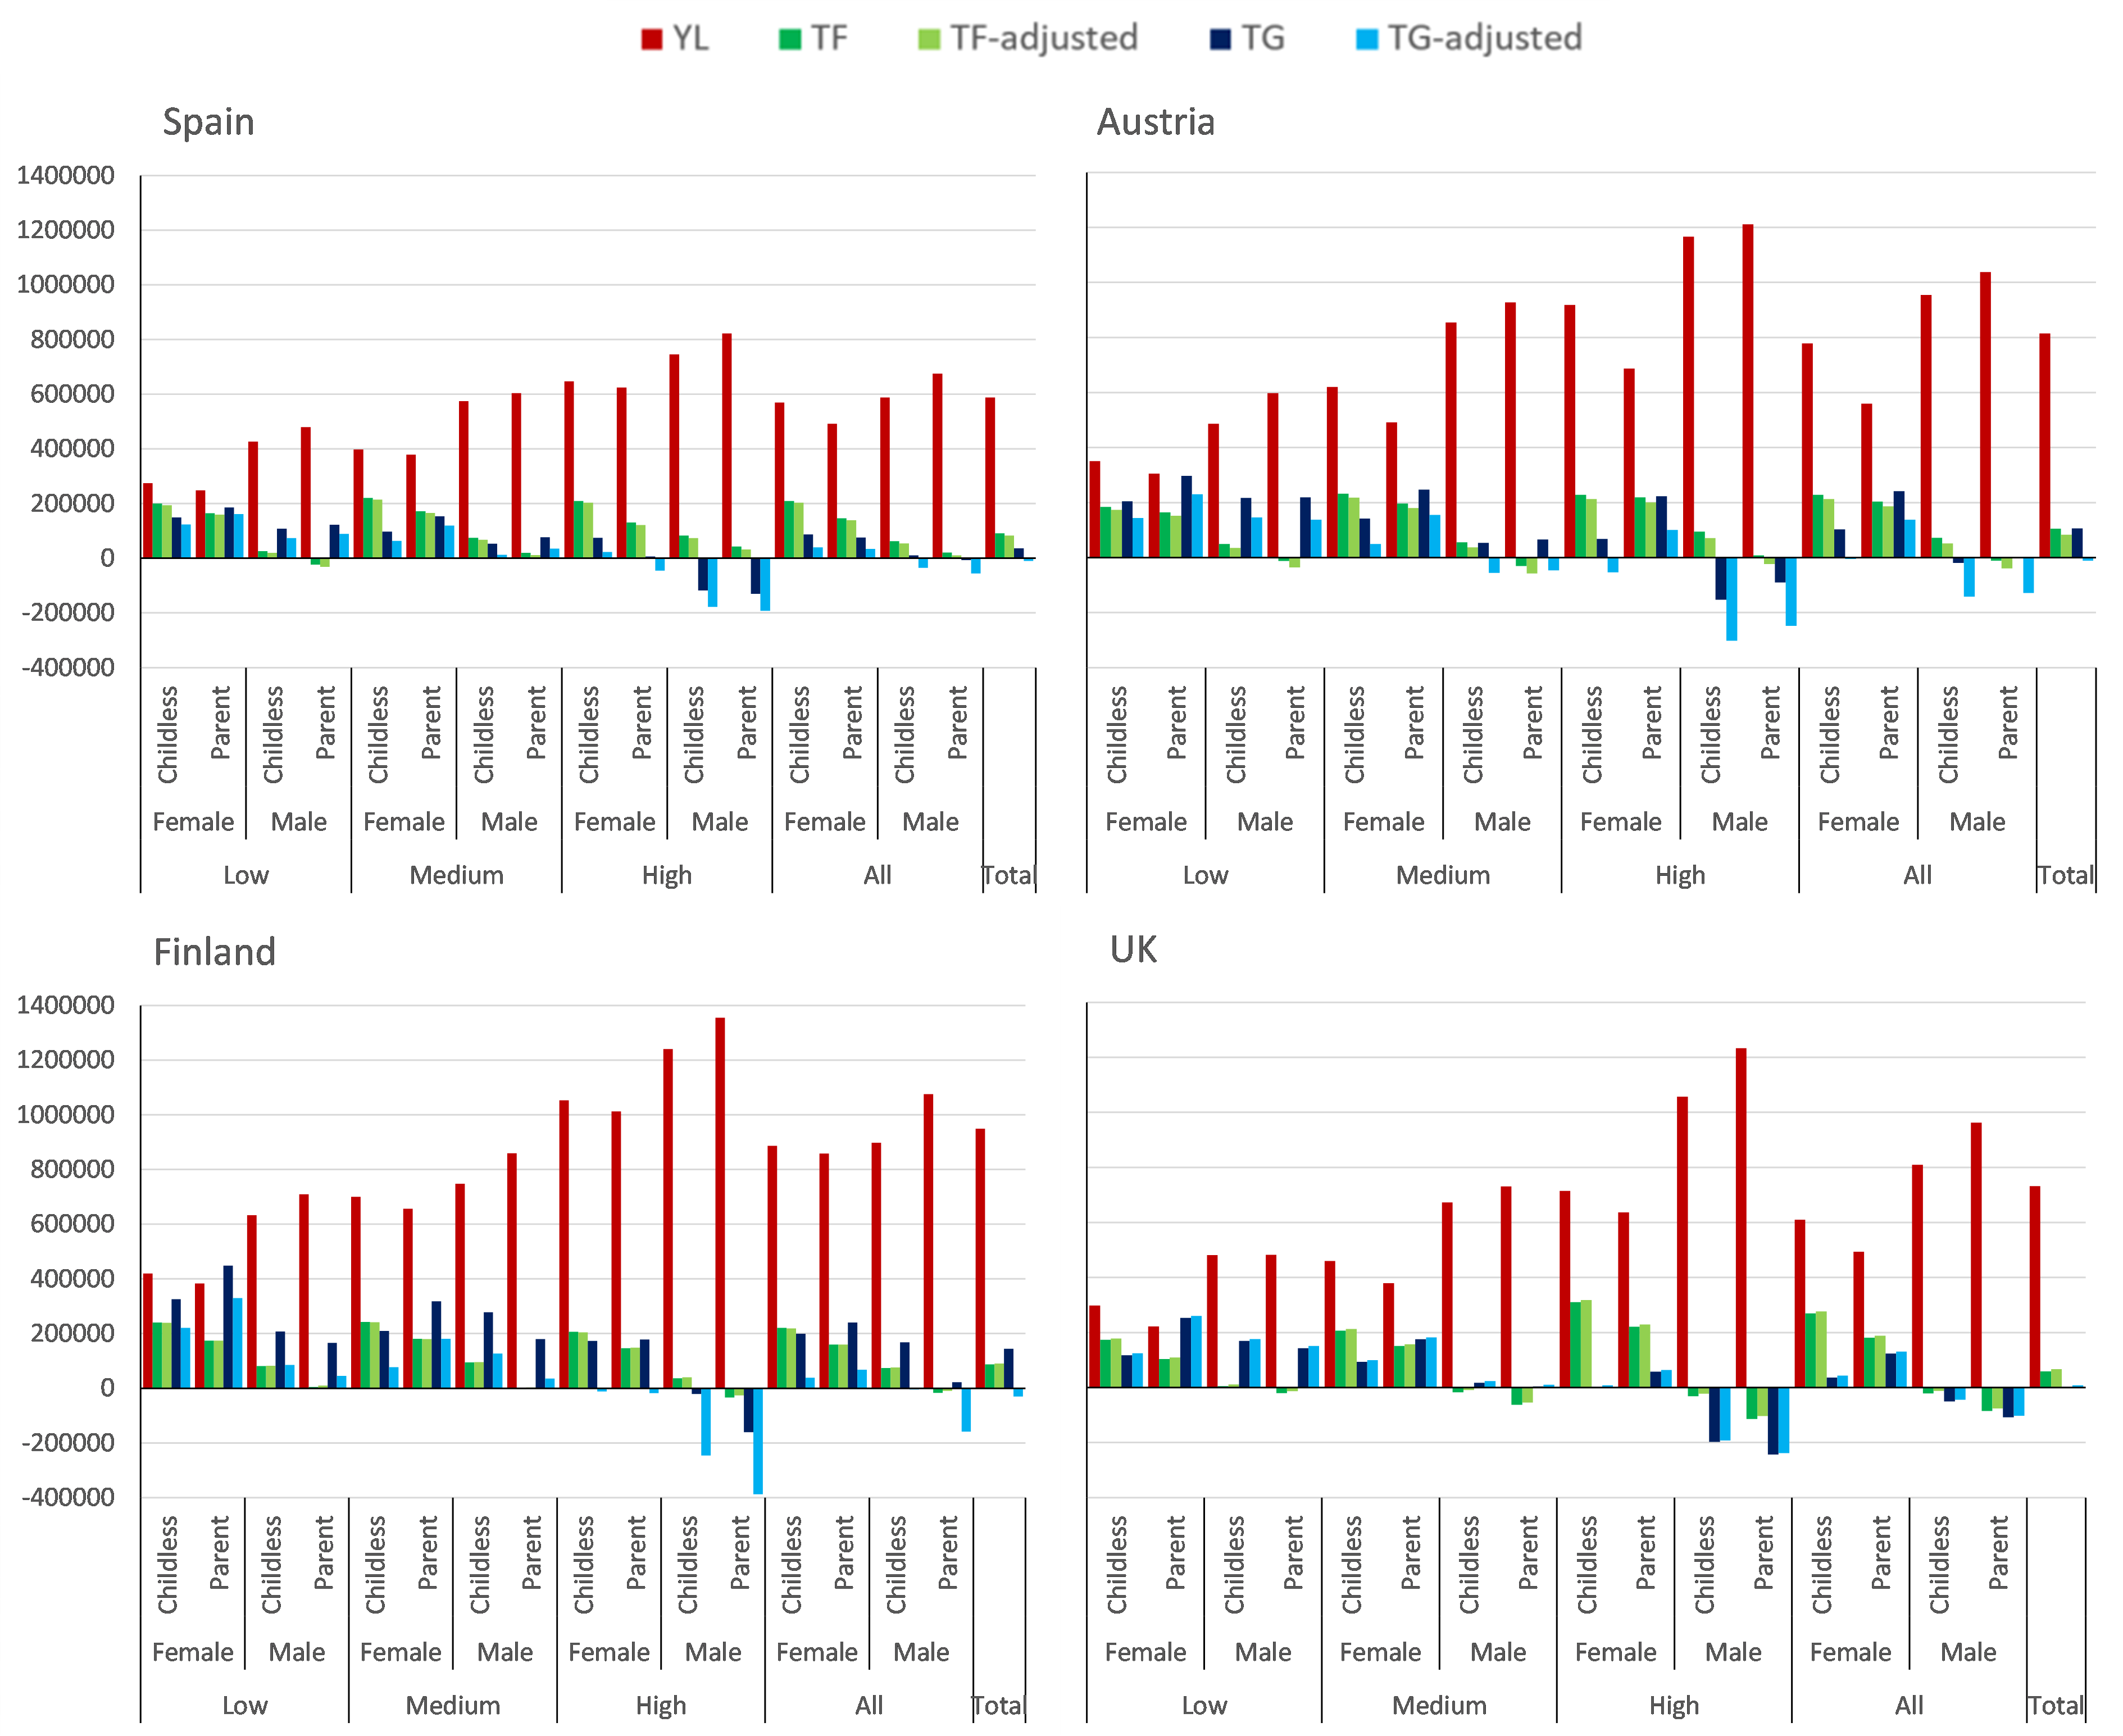
Note: Present value (in €) of labour income (YL), net private transfers (TF), and net public transfers (TG) W/O balancing budgets – 2010 birth cohort.
Figure 8: Net present value of transfers (TF, TG) as a share of the present value of labour income YL
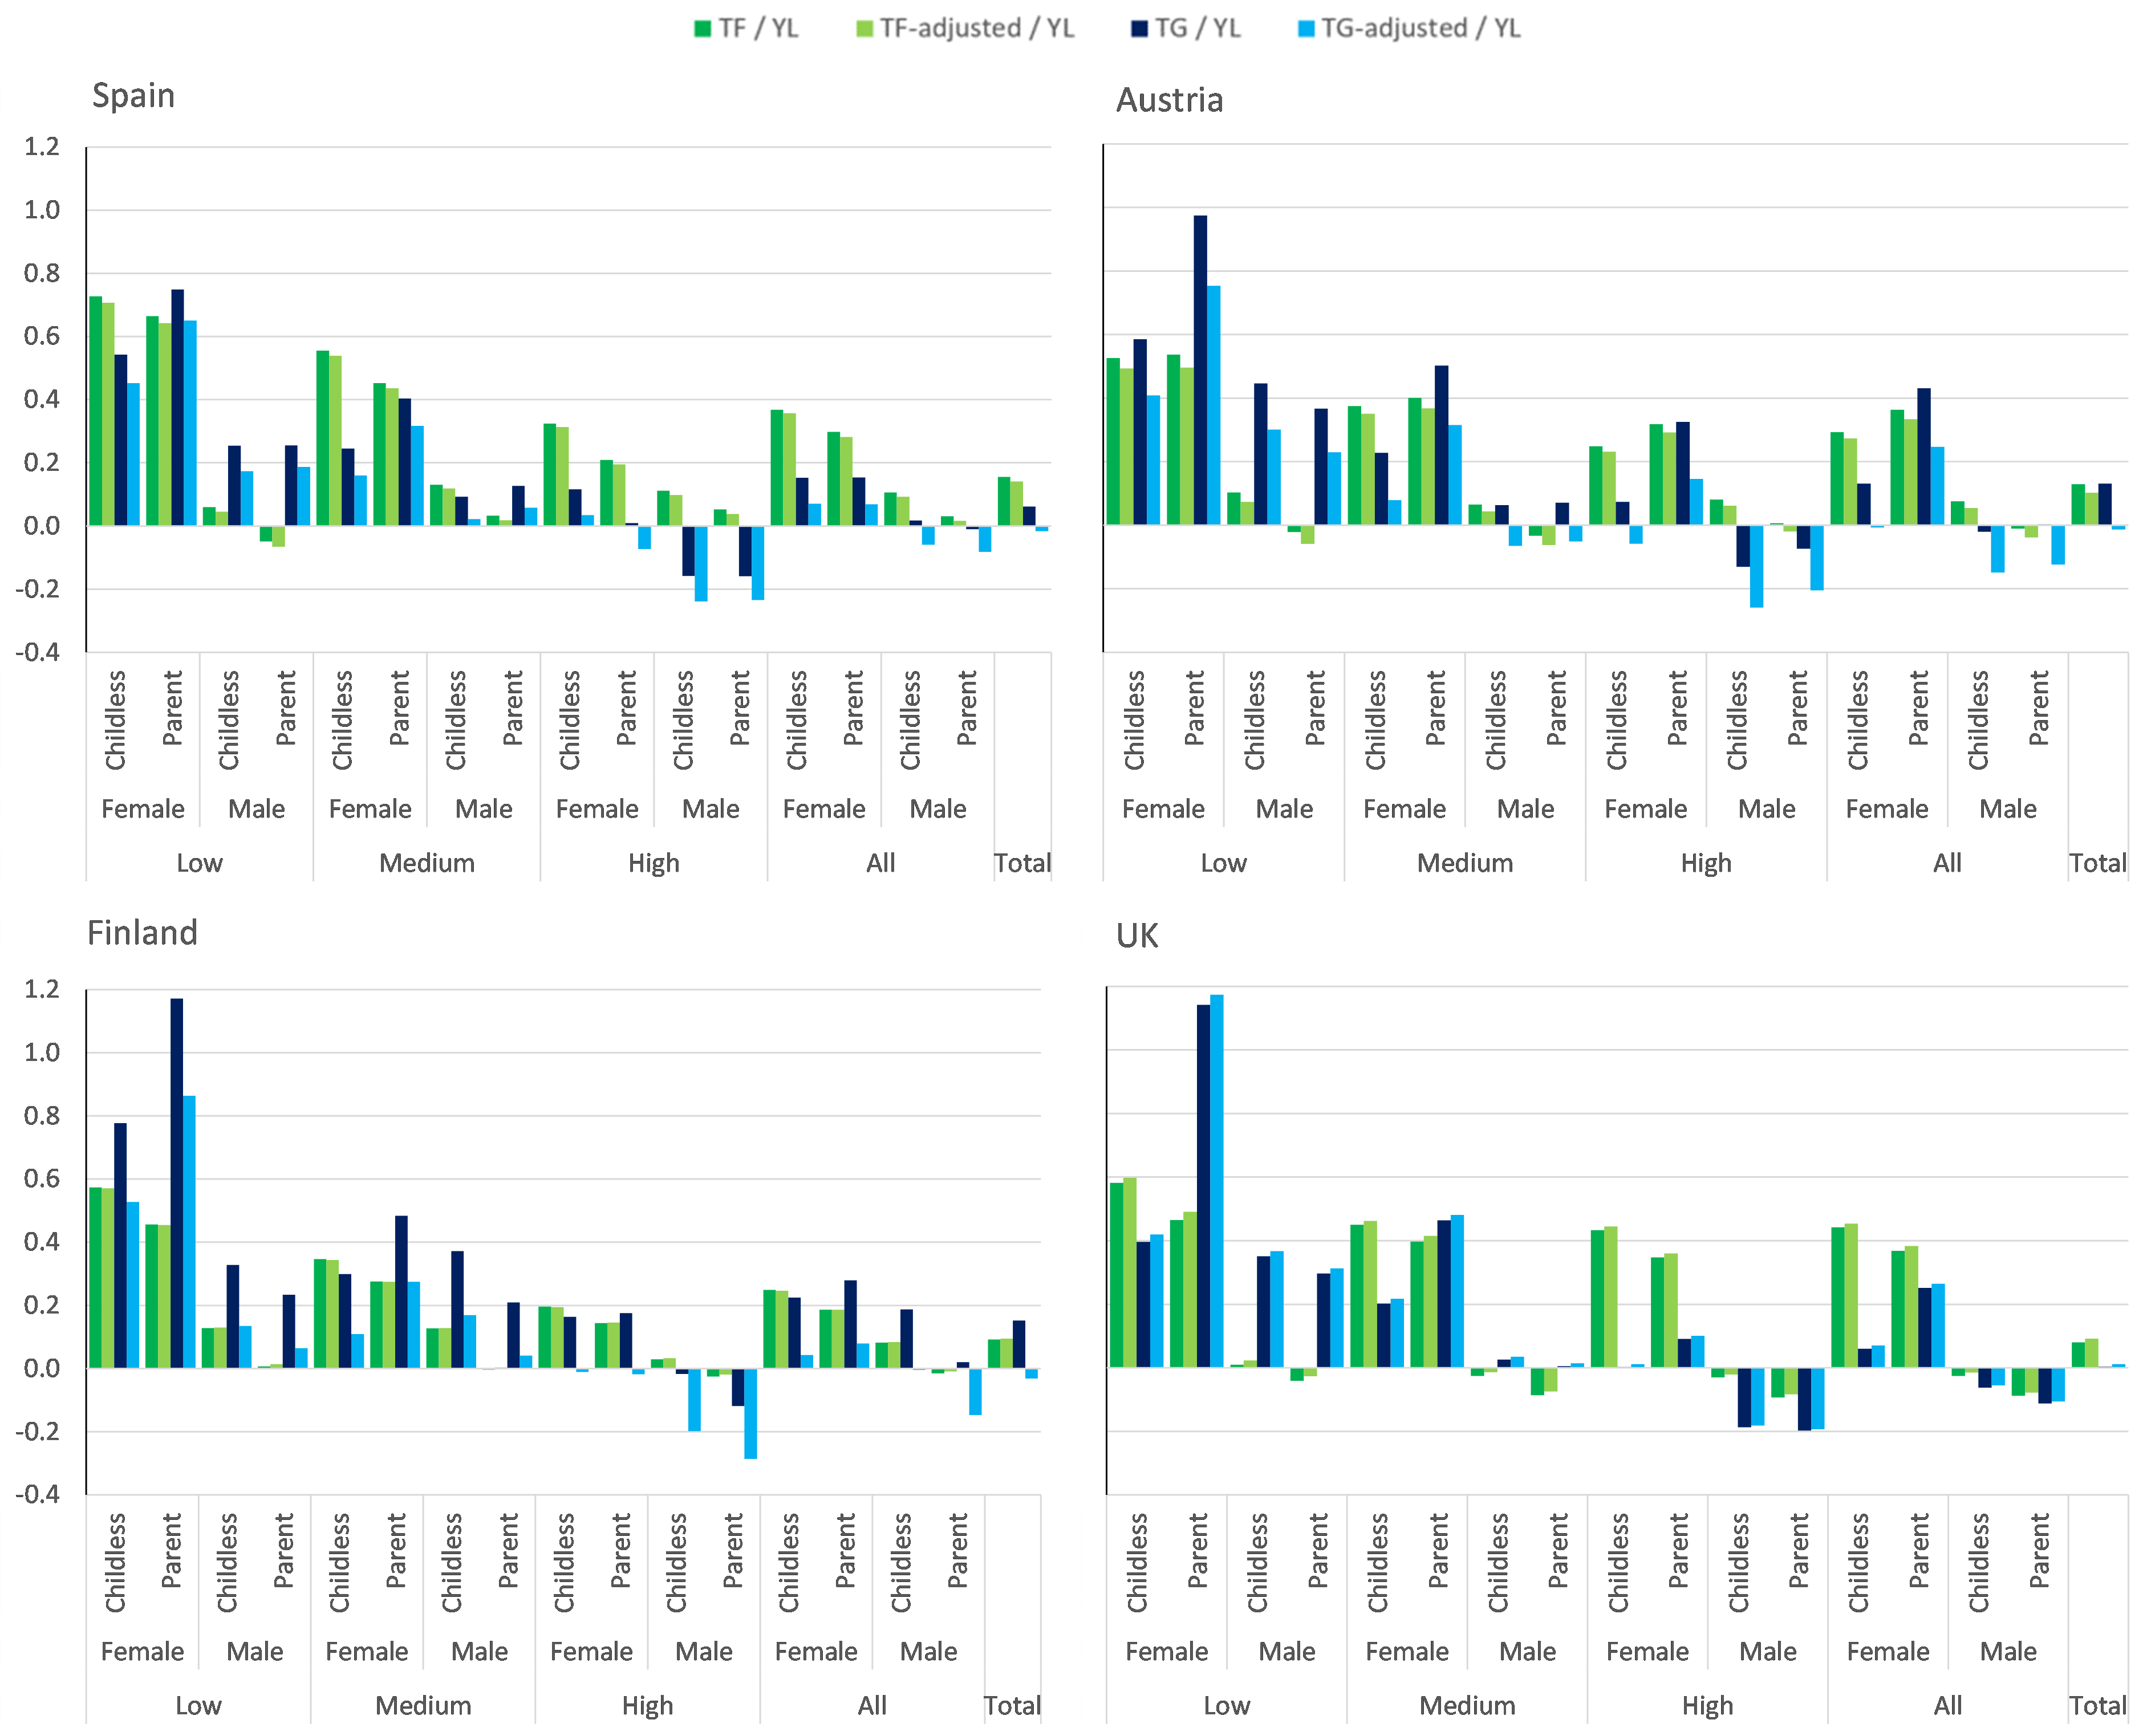
Note: Net present value of private and public transfers as proportion of labour income W/O balancing bugets – 2010 birth cohorts.
In the case of males, Figure 8 shows that childless receive more public transfers than parents in Spain and, especially in Finland. However, in the UK males have a negative present value of their TG, being almost double for parents. Austria and Spain show the lowest values for both childless (slightly positive in Spain and negative in Austria) and fathers (almost zero in both countries). In order to demonstrate these differences, Table 1 shows the PV illustrated in Figures 7 and 8 together with the disaggregated value of inflows (TGI) and outflows (TGO) for the average male. In absolute values, fathers receive more public transfers (TGI) than childless men except in Finland, but they also pay more (TGO). In relative terms, results reverse in most cases: fathers receive less TGI as a share or the present value of their labour income in all cases except in Austria, where childless and fathers receive exactly the same. To understand the differences between countries, the last rows in Table 1 are particularly helpful. For example, in Spain, fathers pay TGO by 8.2% more than childless men, while they receive (TGI) only 4.5% more. The extreme case is Finland, where parents pay 13.5% more, while they receive 2.5% less. Austria, on the contrary, seems to be more father-friendly, as they receive 8.7% more than childless men, paying only 5.4% more.
Finally, regarding private transfers (TF) in absolute terms (Figure 7), they are higher for childless individuals than for parents. They receive transfers from their parents while young, but do not transfer resources to their kids during their working age. For Austrian females, the difference is small and reverses in relative terms. Additionally, it is worth mentioning that according to the results, men give more private transfers (or become net givers) because, by assumption, in the standard NTA method only household heads (mostly men) transfer resources to other household members.
Table 1: Detailed public transfers for males born in 2010 by parenthood status
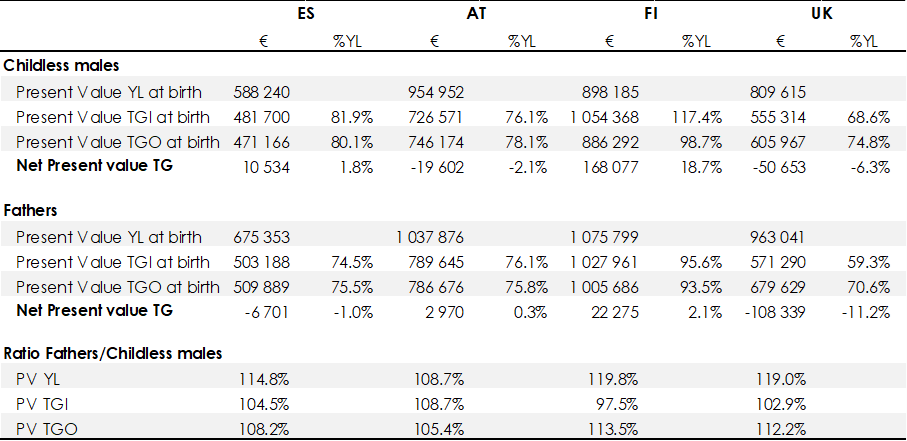
Figure 9 summarises the results in Figure 8, by showing the net present value of private and public transfers by education and parenthood status for the 2010 birth cohort. As noted above, net public transfers are highly redistributive among different educational groups – low and medium educated being net receivers of public transfers, whereas the higher educated are net payers. The differences between low and high-educated individuals are more pronounced in Austria and the UK. In the UK net public transfers for the lower educated are substantially higher, especially for parents, which follows the literature explaining that in liberal countries, the state mainly takes care of low-income individuals. Moreover, the figure reveals that private transfers are the highest in Spain, which results from the extended role of the family emphasised in the Mediterranean countries. The exception are high educated childless individuals in the UK, who are the ones receiving the highest amount of private transfers, which is explained by the lower coverage of public education and hence, the higher private cost of education in this country.
Presenting results by parenthood status and education, but not distinguishing by gender (as done in Figure 9), individuals of all groups are net receivers of private transfers over their whole life cycle. This holds for all the countries, whatever the level of education and parenthood status. This result is partly attributable to the discount effect in computing the present value: individuals are net receivers of private transfers in young ages and net givers during older ages, later transfers being discounted at a greater extent. On the other hand, Figure 9 also reveals that net private transfers are higher for non-parents in all the countries, independently of their level of education. This is mainly explained by the higher amount of private transfers that parents give when raising their kids.
The question arises as to whether, as a result of the welfare state policies, lower net private transfers for parents are at least partially compensated by higher public transfers received by parents. The difference between parents and non-parents could result from family tax deductions, higher family transfers, lower labour market participation rates, among other factors. However, this only holds for low and medium educated. In Spain, Finland and the UK, highly educated parents are net payers of public transfers at a greater extent than non-parents. The difference between high-educated parents and non-parents is particularly high in Spain, emphasising the lack of redistributive family policies for the higher educated. Figure 9 shows that, in the majority of cases, parents’ higher public net transfers are not enough to compensate for the lower net private transfers. The exceptions are the low-educated in the UK (they receive much higher total transfers) and the low and medium-educated in Austria (where parents and non-parents receive practically the same, public policy compensating fully for differences in private transfers.
Figure 9: Net present value of private (TF), public (TG) and total transfers
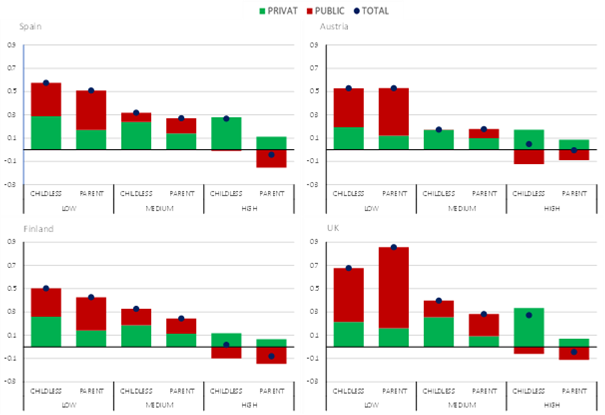
Note: Net present value of private, public and total transfers as proportion of labour income W/O balancing bugets – 2010 birth cohort.
Figure 10 shows for cohorts alive in 2010 (born in the base year or before), the NPV of public transfers (Generational Accounts) together with the equivalent figure for private transfers and total transfers (Full Generational Accounts, FGA) in 2010. While again representing net present values (NPV), only the values for age 0 include the full life-cycle payments of the cohort; for all other cohorts, the values refer to the remaining lifetime transfers (which explains the age shape). Net private transfers are in general positive for children and negative for cohorts currently in working age, tending to zero afterwards. Public transfers are also positive for children and negative at working ages. Nevertheless, they become strongly positive for the elderly. Regarding the discounting effect, the positive discount rate reduces the present value of net transfers, the more, the farther they are from the initial year.
Figure 10: Full Generational Accounts for living generations by the level of education
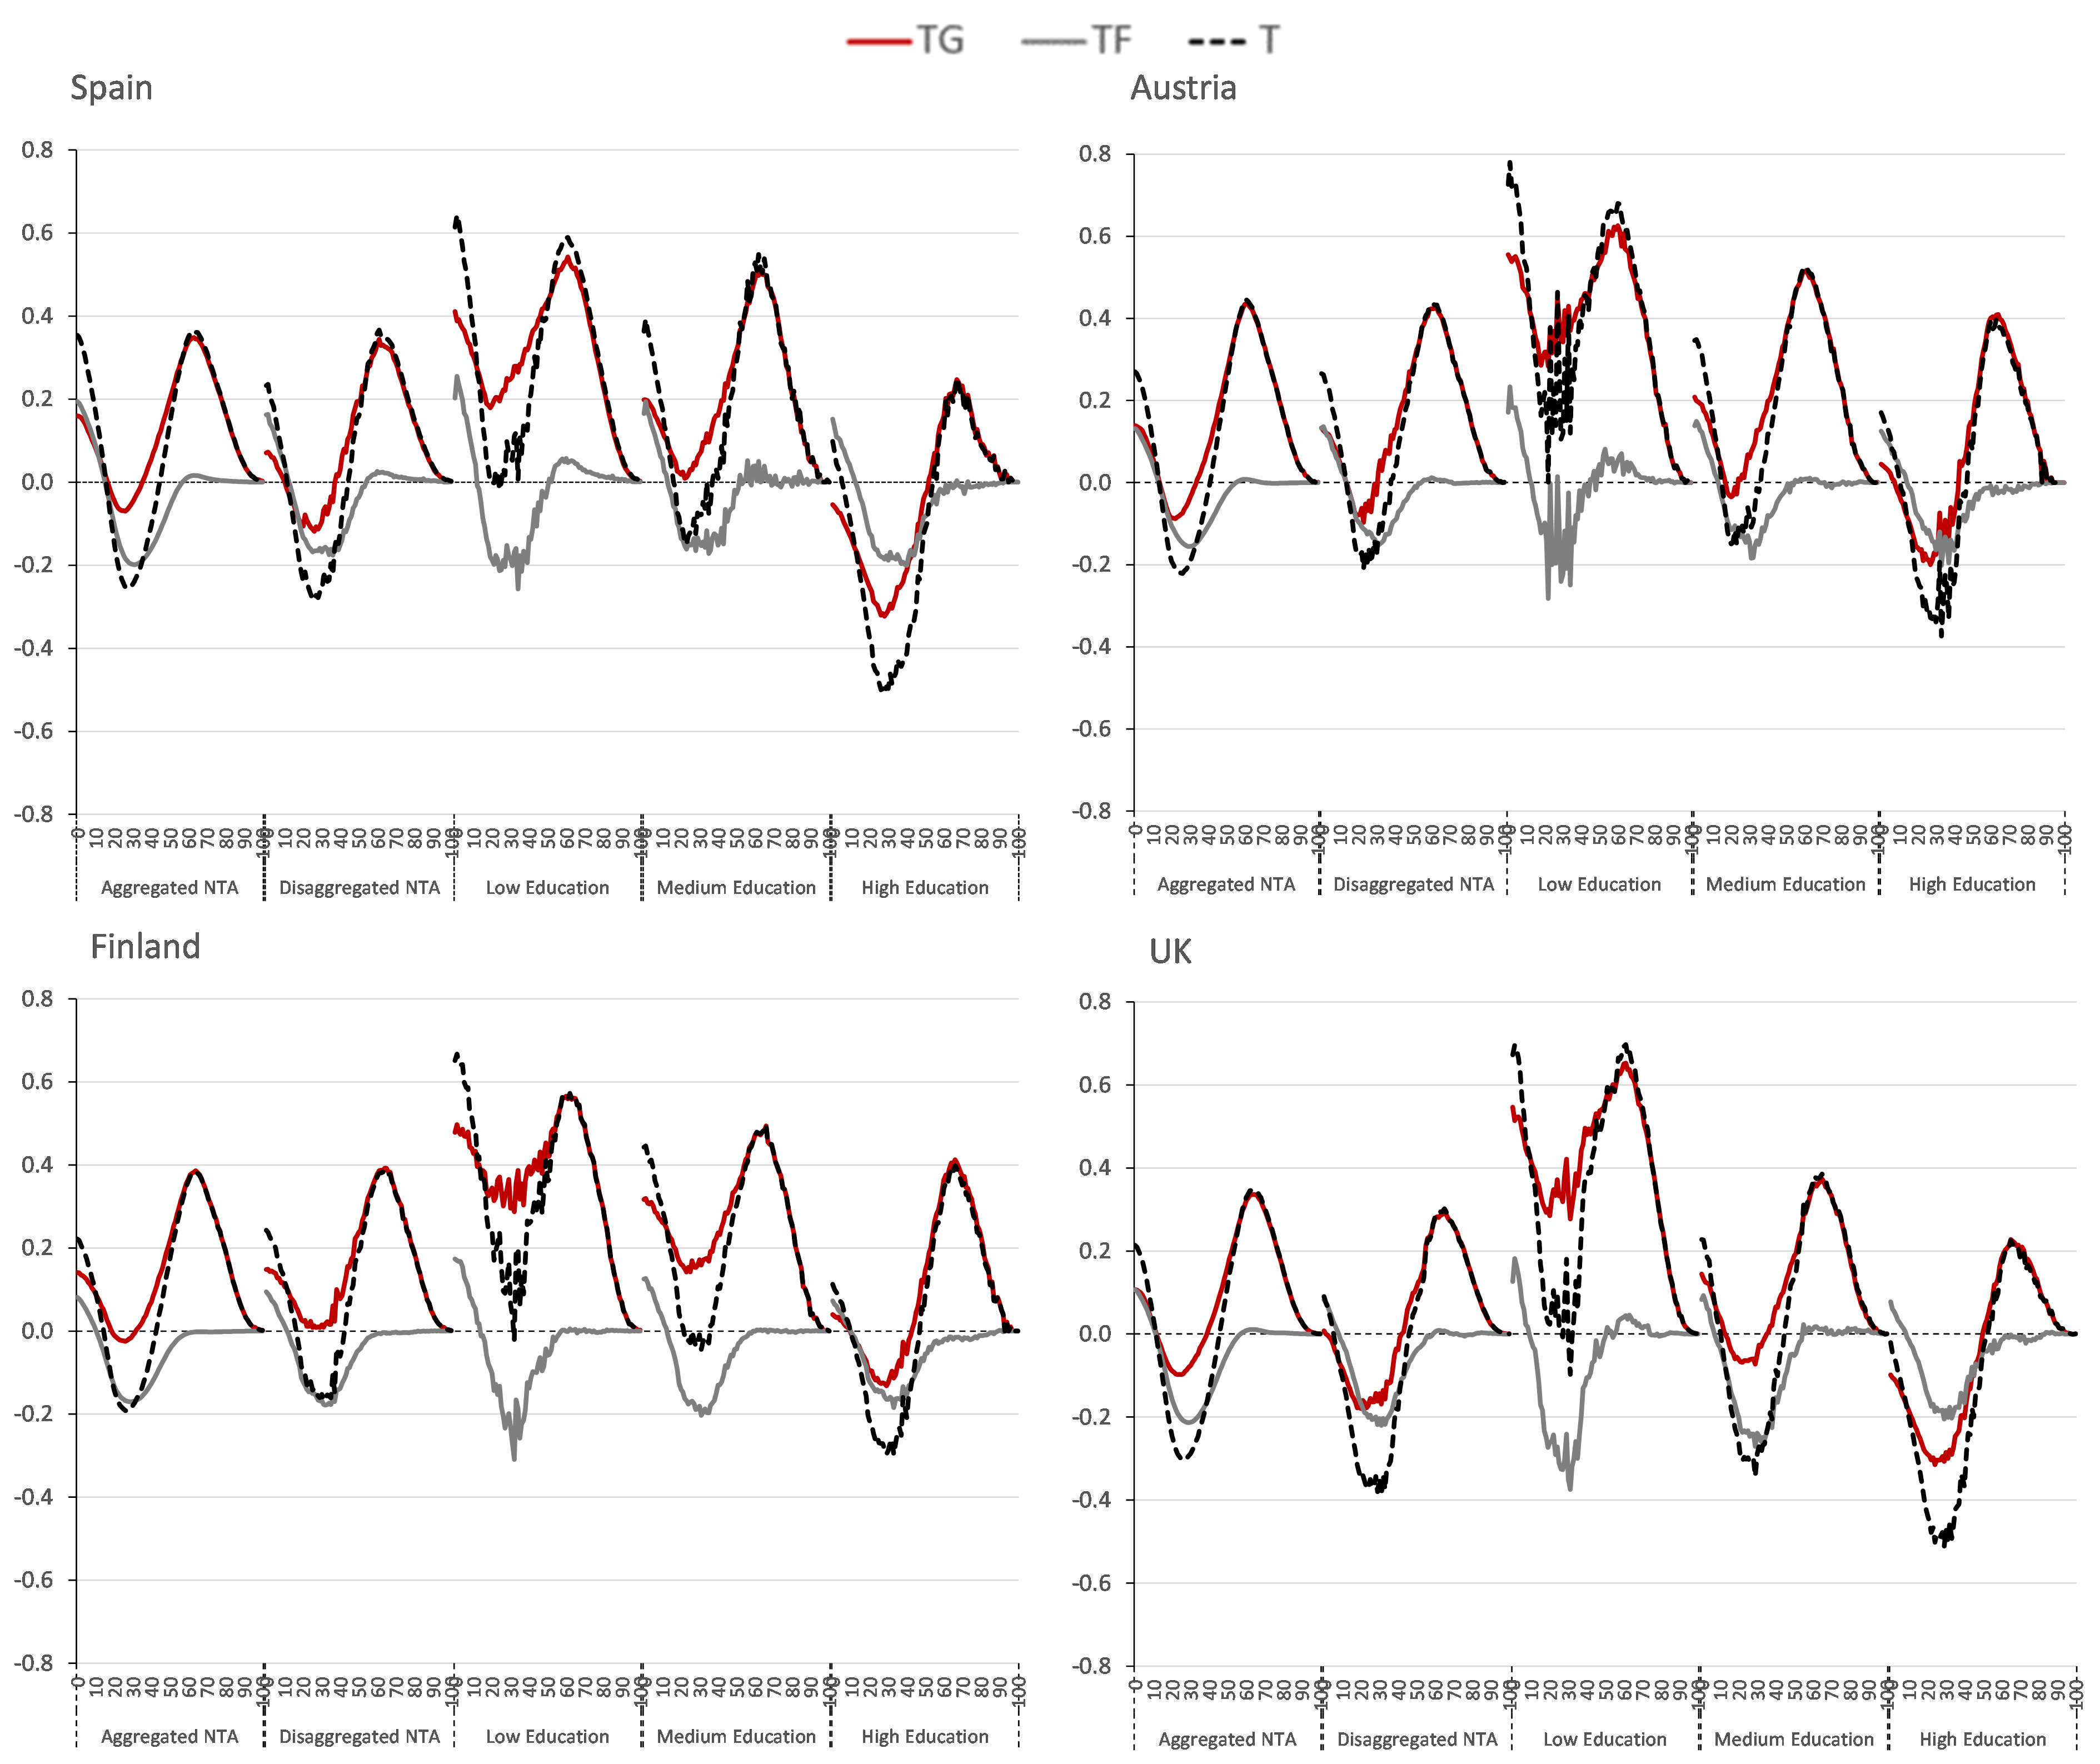
Note: Full Generational Accounts = net present value in 2010 of future lifetime transfers by age as proportion of the present value of lifetime labour income of a new-born in 2010, no adjustments to balance budgets.
The initial value of the Full Generational Accounts in Figure 10 is the same as the (not adjusted) NPV shown in the preceding figures. For the average individual, it is positive both for public and private transfers. When children start growing up, two forces are interacting. On the one hand, the transfers left to be received are lower, and this reduces the NPV. On the other hand, the payments to be made during working age become closer, reducing the NPV as well. Both effects explain the decreasing trend at the beginning. When young adults enter the labour market, the payments to the public sector start, as well as transfers to own children, so that remaining payments start decreasing. This explains the increasing path of NPV for both TF and TG. The private NPV tends to zero, while an additional effect occurs for public transfers. As adults age, the future pension receipts become closer, and the NPV continues increasing until they retire and start receiving pensions so that the transfers left decrease again tending to zero. The age path of total transfers (Full Generational Accounts, FGA) follows this evolution, being at the end mainly driven by public transfers, as private transfers become close to zero. This age pattern is reproduced at all educational levels. The shape of NPV of private transfers is quite similar by education level, while substantially different for public transfers. In the four countries the low educated receive net public transfers. Likewise in Finland and Spain, the medium educated are net recipients too. However, the higher educated are always net donors in all countries up to cohort aged 42 in the base year in Austria and Finland (49 in UK and 52 in Spain).
Figure 11: Full Generational Accounts for living generations by family type and education level
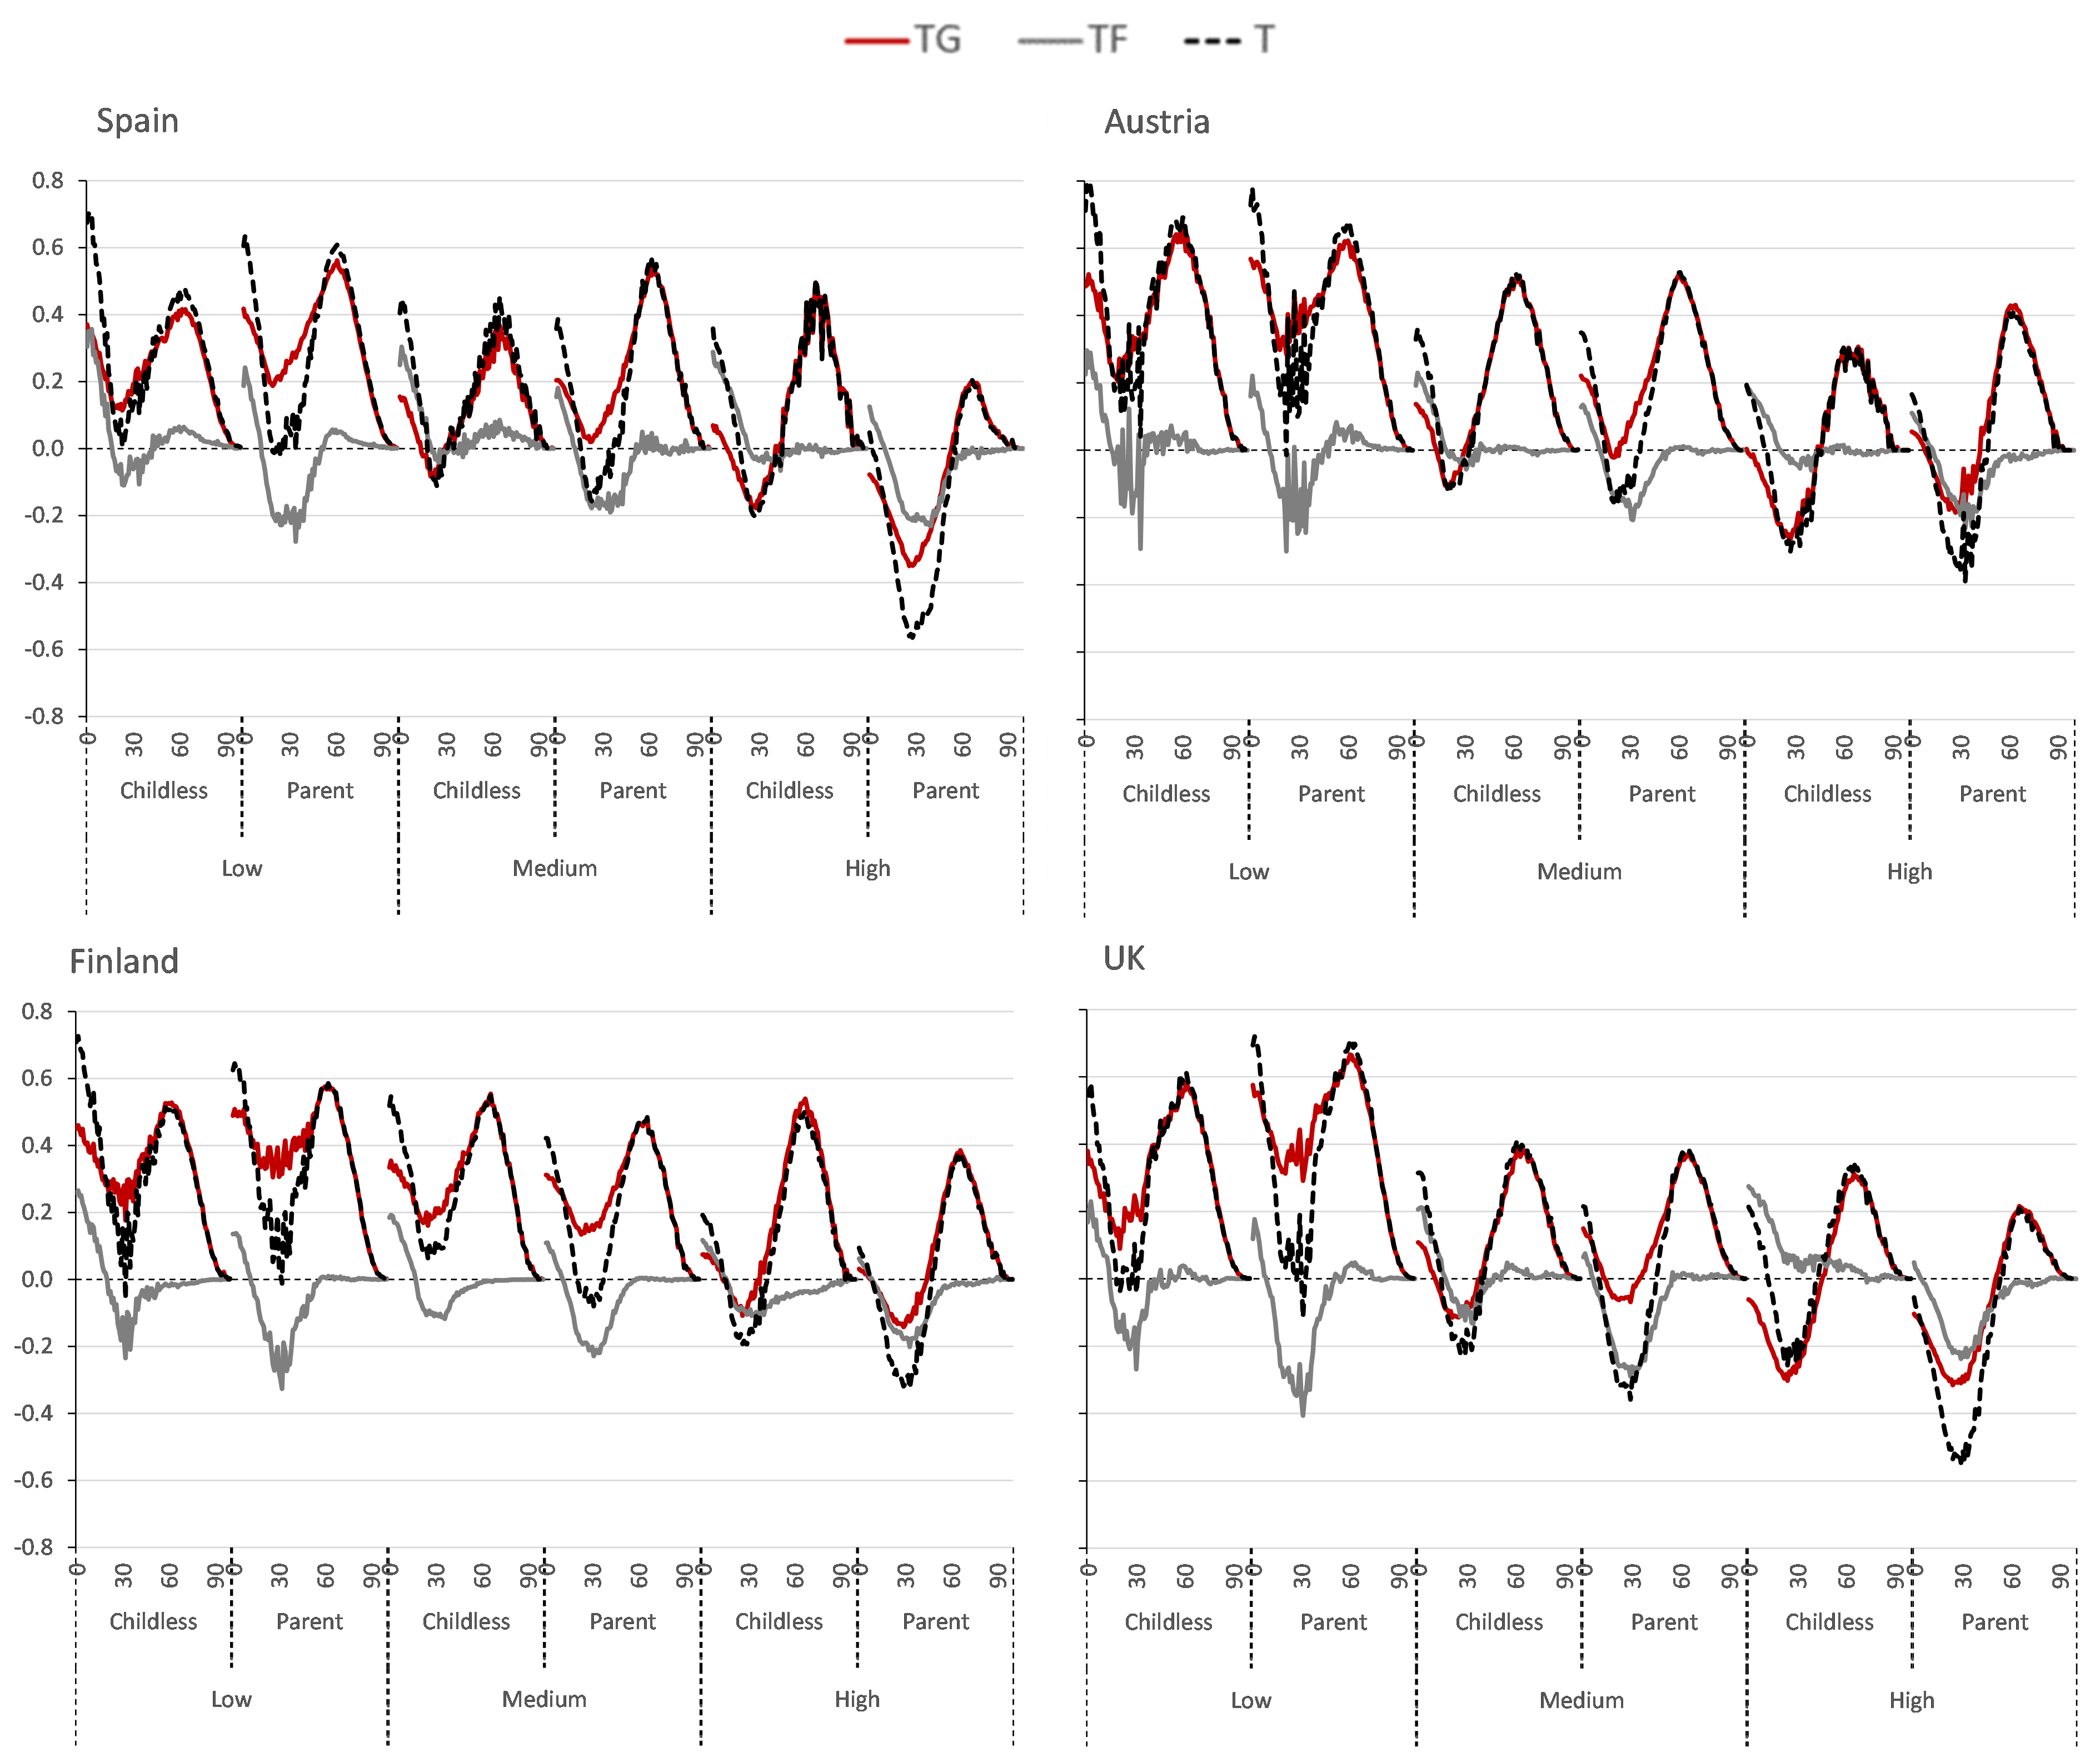
Note: Full Generational Accounts – net present value in 2010 of future lifetime transfers by age as proportion of lifetime labour income of a new-born in 2010, no adjustments to balance budgets.
Figure 11 shows the same results further disaggregated by education level and by parenthood status. The pattern of private transfers differs clearly between childless and parents – the latter giving substantial more during their working lives. In the case of public transfers, there are visible differences among countries. In Austria, parents of any level of education always receive more net TG less than childless of the same cohort. However, in the rest of the countries, high-educated parents show lower net TG than childless for almost every cohort.
Summary and Discussion
In this paper, National Transfer Accounts (NTA) data are combined with Generational Accounting concepts to study the inter and intragenerational income distribution produced by the different welfare state regimes, from a longitudinal perspective. To that end, the dynamic microsimulation model microWELT is used. The study is based on disaggregated NTA data, accounting for age, gender, education, and family type. This allows to compute Full Generational Accounts (including both public and private transfers) for current and future generations by gender, highest education ever reached, and by ever having had children. Our study follows a comparative welfare state approach, covering four countries: Spain, Austria, Finland and the UK.
The aggregate Generational Account for public net transfers for generations born in 2011 is positive and amounts from 11% of the present value of labour income in the UK to the 16% of the present value of the labour income in Spain. The adjustment required to balance budgets in the context of population ageing reduces this value to zero. Disaggregating NTA introduces substantial differences. The net payments by education levels differ substantially between higher and lower education groups (i.e. from 55% to 5% of the PV of labour income in Austria and from 40 to -1% in Spain). In all the analysed countries, the higher educated remain the only net taxpayers when the budget is balanced.
Before adjusting the budgets, the average NPV of private transfers for the cohort born in 2010 is substantially higher than for public transfers in Spain and the UK (where the NPV of public transfers is almost zero). On the other hand, Finland shows just the opposite situation, where the NPV of public transfers is almost double than private transfers. Austria shows similar numbers. Numbers in Finland and Austria also reflect the growing substitution of private transfers by public transfers as the size of the welfare state increases.
When looking at disaggregated results by family type, private transfers are in absolute terms observed to be higher for childless individuals than for parents. Childless individuals receive transfers from their parents while young, but do not transfer resources to children during their working age. However, different outcomes in terms of public transfers can be observed. In general, mothers receive more public transfers than childless women do. However, this does not hold in Spain, where childless women earn slightly more than mothers.
Among countries, there exist differences in the importance of public and private transfers in the intergenerational redistribution. In Austria, the magnitude of public and private transfers is almost the same. In the UK, private transfers’ net present value is significant, whereas the net present value of public transfers is negligible. In contrast, in Finland, public transfers’ present value is much higher than the NPV of private transfers, whereas just the opposite is true in Spain. Therefore, results show a clear north-south division of countries as well as the need for distinguishing between Continental and Mediterranean countries, which becomes particularly clear when private transfers are included in the analysis.
We found significant differences in the interplay between private and public transfers related to parenthood. While in all the countries parents privately give substantially more transfers to others, the Austrian welfare state fully compensates for these differences through higher public transfers to parents; such compensation is much weaker and more targeted towards the lower educated in the other countries
References
- Abio, G., Patxot, C., Souto, G., Istenič, T. (2020), Disaggregated National Transfer Accounts by Education and Family Types for Spain, UK, Austria, and Finland. University of Barcelona Working Paper 2020, forthcoming.
- Albertini, M., Kohli, M. (2013). “The Generational Contract in the Family: An Analysis of Transfer Regimes in Europe”. European Sociological Review, 29(4), 828-840.
- Albertini, M., Kohli, M., Vogel, C. (2007). “Intergenerational transfers of time and money in European families: common patterns—different regimes?”. Journal of European Social Policy, 17(4), 319-334.
- Attias-Donfut, C., Ogg, J., Wolff, F.-C. (2005). “European patterns of intergenerational financial and time transfers”. European Journal of Ageing, 2(3), 161-173.
- Auerbach, A., Gokhale, J., Kotlikoff, L. (1991), “Generational accounting: a meaningful alternative to deficit accounting”. Tax Policy and the Economy, 5, 55-110.
- Bambra, C. (2005). “Cash versus services:‘worlds of welfare’and the decommodification of cash benefits and health care services”. Journal of social policy, 34(02), 195-213.
- Brandt, M., Deindl, C. (2013). “Intergenerational Transfers to Adult Children in Europe: Do Social Policies Matter?”. Journal of Marriage & Family, 75(1), 235-251.
- Busemeyer, M., Nikolai, R. (2010). Education FG Castles, S. Leibfried, J. Lewis, H. Obinger, C. Pierson (red.). In S. L. FG Castles, J. Lewis, H. Obinger, C. Pierson (red.) (Ed.), The Oxford Handbook of the Welfare State.
- Esping-Andersen, G. (1990). The three worlds of welfare capitalism. Princeton: Princeton University Press.
- Esping-Andersen, G. (1999). Social foundations of postindustrial economies. New York: Oxford University Press.
- Ferrera, M. (1996). “The’Southern model’of welfare in social Europe”. Journal of European social policy, 6(1), 17-37.
- Hernes, H. M. (1987). Welfare state and woman power: Essays in state feminism. Oslo: Scandinavian University Press.
- Istenič, T., L. Vargha, Sambt, J. (2019). “Is there a connection between welfare regimes and inter-age reallocation systems?”. Journal of the Economics of Ageing 14:100202, DOI: 10.1016/j.jeoa.2019.100202
- Lee, R., McCarthy, D., Sefton, J., Sambt, J. (2017). “Full Generational Accounts: What Do We Give to the Next Generation?”. Population and Development Review, 43(4), 695-720.
- Leibfried, S. (1993). “Towards a European welfare state”. In J. Catherine (Ed.), New perspectives on the welfare state in Europe (pp. 133-156). New York: Routledge.
- Lewis, J. (1992). “Gender and the development of welfare regimes”. Journal of European social policy, 2(3), 159-173.
- Mudrazija, S. (2014). “The balance of intergenerational family transfers: a life-cycle perspective”. European Journal of Ageing, 11(3), 249-259.
- Mudrazija, S. (2016). “Public transfers and the balance of intergenerational family support in Europe”. European Societies, 18(4), 336-358.
- Patxot C., Renteria E., Sánchez Romero M., Souto G. (2012). “Measuring the balance of government intervention on forward and backward family transfers using NTA estimates: the modified Lee arrows”. International Tax and Public Finance, 19, 442-461.
- Patxot, C., Renteria, E., Sánchez-Romero, M., Souto, G. (2011). “Integrated results for GA and NTA for Spain: some implications for the sustainability of welfare state”. Moneda y Crédito, 23, 7-51.
- Sánchez-Romero, M., Abío, G., Botey, M., Prskawetz, A., Sambt, J., Sole, M., Souto, G., Vargha, L., Patxot, C. (2019), “Welfare state winners and losers in ageing societies”. Vienna Yearbook of Population Research, 17, 9-36.
- Saraceno, C., Keck, W. (2010). “Can we identify intergenerational policy regimes in Europe?”. European Societies, 12(5), 675-696.
- Spielauer, M., Horvath, Th., Fink, M. (2020a), microWELT: A Dynamic Microsimulation Model for the Study of Welfare Transfer Flows in Ageing Societies from a Comparative Welfare State Perspective. WIFO Working Paper, 609, 2020.
- Spielauer, M., T. Horvath, W. Hyll, M. Fink (2020b), microWELT: Sociodemographic Parameters and Projections for Austria, Spain, Finland and the UK. WIFO Working Paper, 611, 2020.
- Spielauer, M., T. Horvath, M. Fink, G. Abio, G. Souto Nieves, C. Patxot, T. Istenič (2020c), microWELT: Microsimulation Projection of Indicators of the Economic Effects of Population Ageing Based on Disaggregated National Transfer Accounts. WIFO Working Paper 612, 2020.
- Spielauer, M., T. Horvath, M. Fink, G. Abio, G. Souto Nieves, C. Patxot, T. Istenič (2020d), microWELT: Microsimulation Projection of Full Generational Accounts for Austria and Spain. WIFO Working Paper 618, 2020.
- Stoy, V. (2014). “Worlds of Welfare Services. From Discovery to Exploration”. Social Policy & Administration, 48(3), 343-360.
- West, A., Nikolai, R. (2013). “Welfare regimes and education regimes: Equality of opportunity and expenditure in the EU (and US)”. Journal of Social Policy, 42(03), 469-493.