3. The MicroWELT Model
MicroWELT is a socio-demographic projection model aiming at capturing some key welfare-state related patterns in education and family careers. While being able to reproduce available aggregate demographic and education projections (e.g. Eurostat, Ageing Report), microWELT adds realism in individual life courses and the differences in life-courses by education. Specifically, the model addresses life expectancy differentials, the differences in childlessness and timing of first birth, as well as differences in partnership formation and stability by education. Education is modeled combining macro projections (highest level and enrollment rates) with observed intergenerational transmission processes and individual study patterns. The model integrates NTAs and accounting routines. Keeping track of partnership status, children in the household and education, the model allows the use of NTA data broken down by family types (partnership status, presence and age of children, childlessness) and education (of parents for children and students, own education otherwise). MicroWELT produces a series of NTA indices proposed in the literature. Longitudinal accounting also allows to study welfare flows between cohorts and between education groups. Specifically, the model is designed to address the redistribution between education groups in the context of life expectancy differences. MicroWELT is implemented in Modgen, a dynamic programming language developed and maintained at Statistics Canada. It is a continues time interacting population model supporting the (optional) alignment of a set of key aggregated demographic and education outcomes.
3.1. Data requirements
The starting population is generated from Euromod input data and various parameters are estimated directly from this data set. Another micro-data source used in the project are Labor Force Surveys. Demographic scenarios and corresponding mortality, fertility, and migration parameters come from Eurostat population projections complemented by own estimations and projections found in literature. A full documentation of data sources together with analysis scripts will be made available on the project website. The model is designed to be portable to other countries and to a large extent parameter generation is automated.
The model allows the parallel parameterization of NTA variables by four levels of disaggregation: by age, by age and sex, by age, sex and education, and by age, sex, education and family type. Data further disaggregated by education - and by family type – are calculated alongside the Weltransim Project for Spain, Austria, the UK, and Finland. For a growing set of countries, NTA data by education are also calculated and used alongside other research project (e.g. Renteria et al., 2016 and Hammer 2015).
3.2. Fertility
MicroWELT uses age specific fertility rates from Eurostat population projections. While reproducing these macro projections (which account for differences in total fertility), MicroWELT aims at obtaining a realistic distribution of family sizes by education. This is done by a fertility module which models individual birth risks by individual level characteristics like education and parity. Empirically, the distribution of family sizes in most European countries followed a trajectory from high concentration at the beginning of the past century, to a very equal distribution in the baby boom, back to an increasing concentration, especially higher educated women having increasing rates of childlessness (e.g. Spielauer 2005, Shkolnikov et.al. 2007). These patterns vary between welfare state regimes, e.g. fewer women having a larger share of the children is typically associated with conservative regimes. We simulate birth events by using age specific fertility rates to produce the desired number of births but assign the events to the woman with the shortest random waiting time. Currently we concentrate on first birth patters and levels of childlessness by education. In the case of Spain, the model uses first birth rates by education (own calculations) calibrated to reproduce cohort childlessness by education as presented in Reher, & Requena (2019). In the base scenario, future childlessness is kept at the current level (as estimated for the 1970 birth cohort with a spread between 17% and 27% by education). After first birth rates are met, the remaining births are distributed to mothers by age specific rates.
3.3. Mortality
The ability to quantify the impact of differential longevity by education on redistributive processes is one of the aims of the MicroWELT model. In the presented simulations we assume that the relative mortality risks by education stay constant over time, while total mortality outcomes are aligned to reproduce Eurostat mortality projections. Model parameters are period life tables by sex and estimates of the current remaining life expectancy by education at age 25 and age 65 as published by OECD (Murtin et al. 2017). Relative mortality risks are calculated at the start of the simulation and kept over time, while the age-specific baseline risks are aligned each year to reproduce the target mortality. For estimates on the remaining life expectancy, we used Italy as proxy, as no Spanish data are available. Longevity differentials are higher for men – 3.8 years at 25 and 2.3 years at 65 between the low and high education groups – compared to 2.0 and 1.2 for women. These differentials are typical in an EU wide comparison.
3.4. Education
MicroWELT distinguishes three education levels – low, medium, and high – corresponding to compulsory education, secondary education, and post-secondary education attainments. Highest education eventually obtained is decided at birth by selecting one of two modeling approaches – or by combining them: outcome-parameters for projected age and cohort-specific distributions, and parameters for the distributions by parent’s education. When selecting the model simulating the intergenerational transmission of education, users can choose to align the aggregate outcomes to the external targets. In this case, the odds ratios between groups from the intergenerational transmission models are used to select students based on their parents’ education, while the number of graduates is calculated from the outcome parameters. Accounting for parents’ education is important when modeling NTAs by education, as the transfer a child receives (as well as education choices) depend on the education of parents. Besides the highest educational attainment, MicroWELT also models study patterns, i.e. school enrolment. Again, this is important from the NTA perspective, as we disaggregate NTAs by enrolment status.
In the case of the presented simulations, we selected the intergenerational transmission model without alignment. While Spain experienced a fast education expansion in the recent past, overall trends almost levelled off in our simulation, leading to an almost constant educational composition of future birth cohorts (0.23-0.24-0.53 for women, and 0.31-0.26-0.44 form men). The absence of an overall trend also results from the recent increase in childlessness of higher educated women, the recent education expansion not fully feeding into the education composition of mothers.
3.5. Partnerships
MicroWELT models the female partnership status according to observed partnership patterns by age, education, and the presence and age of children. Appropriate partners are matched by age, education, and childlessness. The model assumes that cet. par. the probability to be in a partnership does not change over time, thus all changes come from composition effects. Besides of changes due to the death of a partner, updates are performed at a yearly basis to maintaining cross-sectional consistency. Under the assumption of time-invariant patterns, the model is longitudinally consistent by education, childlessness and birth cohort – thus allows the calculation of consistent life course measures by these groups - but (currently) does not model consistent individual life-courses within these groups. The partnership status is modeled for all women within the age range 15-80, no more union formation events are modeled thereafter when it is assumed the only union dissolution is due to widowhood.
Male partners are matched by age and education. Men destined to stay childless (a model parameter by education and cohort) avoid unions with mothers unless no other men are found; if in a union at a birth of a child, they pass on their “never father” status to another (childless) men of the same age and education to meet overall childlessness rates. Concerning age differences between partners, the model tries to fit observed distributions by age. Empirically, the spread increases with age. Part of this pattern arises from re-partnering, the distribution of age differences thus differing for new partnerships compared to all observed partnerships. As the former typically cannot be observed in data, at each partnership event, the current age distribution in the simulation is compared with a target distribution and partners are picked to best close the gaps between the two distributions.
3.6. Migration
The migration modules of MicroWELT allow reproducing aggregate projections of immigration by number, age distribution, and sex – and emigration rates by age and sex. Modules for family migration and migration by a set of regions of origin are currently under development in the sister model MicroIMMI (Horvath 2019). For the illustration in this paper, migration is switched off.
3.7. Family Links
MicroWELT models nuclear families. At birth, children are linked to their mother and – if present – their father. This link to biological parents is maintained within the simulation. As the partnership status is only updated on a yearly basis, we assume that if a single mother enters a partnership within the first year of her child, the partner is also the biological partner. Until leaving home, children also keep links to their current “guardians”: in the case of a union dissolution of parents, children choose with whom to live, and if this parent enters a new partnership, a link to this new partner is established. In the case of the death of a single “guardian”, children move back to a biological parent if available, or to grandparents. Children leave home when entering a partnership, becoming parent, or at age 18, if not enrolled in school. Students stay at home up to age 25, the probability estimated from EU-SILC data.
3.8. NTA Variables, Indicators, and Accounting
NTA data are cross-sectional age profiles breaking down national accounting variables on consumption, income, saving, and transfers. Data distinguish between private and public consumption singling out education and health. Public transfers also distinguish pension benefits. NTA data by sex are available for 50 countries, including most European countries: The AGENTA project produced NTA estimates using comparable European data. We further dis-aggregated NTA data by education and family type. MicroWELT allows the user to choose the aggregation level, allowing to compare simulation results based on aggregated profiles with simulations accounting for composition effects along the education and family dimensions. At their most dis-aggregated level, NTA variables in MicroWELT are parameterized by the following population groups:
- Children age 0-16 and students age 17-25: by highest parent’s education
- Non-students age 17-60: by sex, education, presence of partner and children in the household
- Persons 60+ by sex, education, partnership status, and childlessness Figure 1 illustrates NTA shapes for labor income and consumption by education. Labor income is concentrated to work age, higher educated people reaching higher incomes, especially later into their work career and work until higher age. At their peak, the average labor income in the high education group is almost 3 times higher than in the low education group. Consumption is much smoother; also, the differences between education groups are smaller, adult people in the high education group consuming around 50% more than in the lowest group.
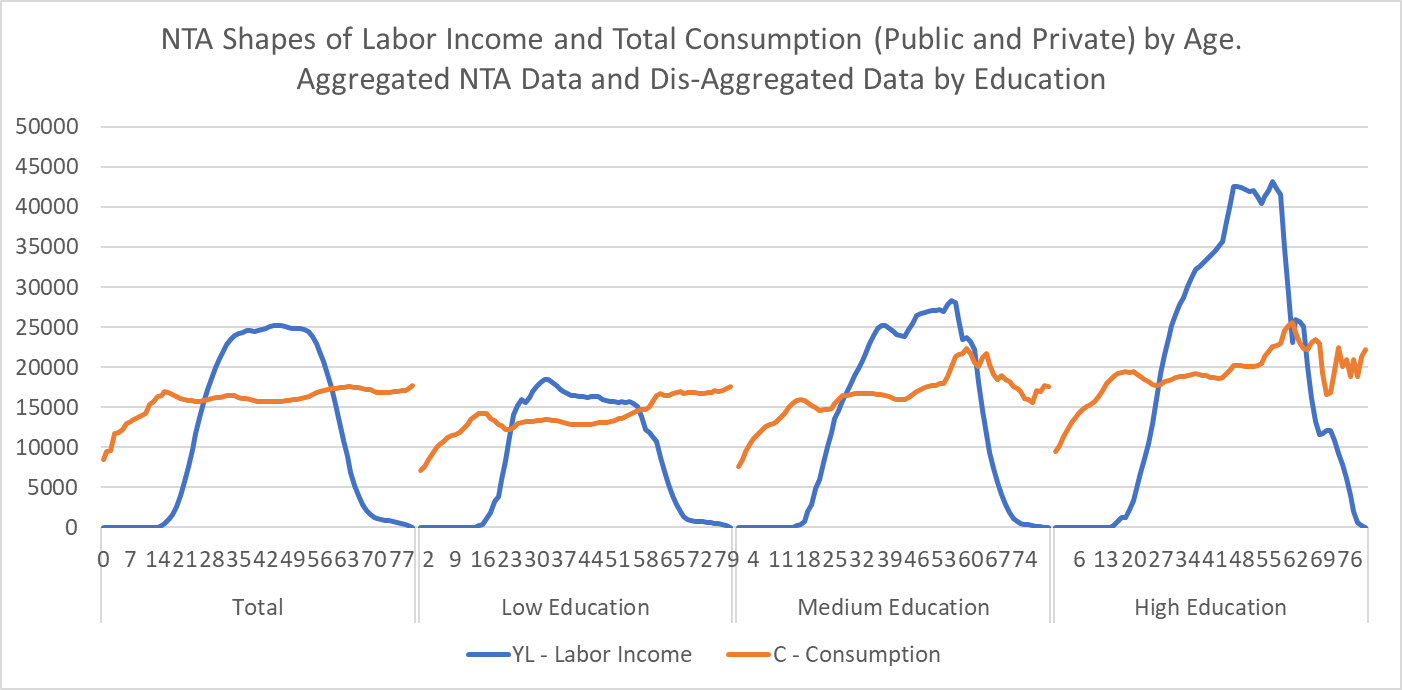 Figure 1: NTA age profiles of labor income and consumption
NTA data provide a detailed picture, how resources are re-distributed by means of public and private transfers and asset re-allocation. MicroWELT implements a set of 19 NTA variables (see Appendix). The NTA based indicators and accounting approaches used in the application examples of this paper are implemented in separate (and optional) modules, each corresponding to the referenced publication introducing the concepts.