4. Applicationm Example: NTA Indicators and Net Present Value of Public Transfers in Spain
In this section we reproduce a set of indicators and projection approaches found in existing literature based on aggregated NTA. We then explore, how results change when using dis-aggregated NTA data accounting for differences by education and family type. We find, that the impact of adding some basic detail and realism to existing projections is considerable, providing a strong rational for the use of dynamic microsimulation to inform projections based on the NTA approach. All presented scenarios reproduce Eurostat fertility and mortality projections (in the aggregate) but set international migration to zero.
The simulations start from the 2010 EUROMOD data with a sample size of 36,594 persons. For each scenario we run 10 replicates of a population of 250,000 persons each, sampled from the starting population database. While the simulation size of 2.5 Million actors eliminates most Monte Carlo variation, it cannot eliminate the starting population randomness of the underlying population sample. Dis-aggregated NTA variables rely on small samples and – for single years of age - are subject to high parameter uncertainty. As all presented indicators and accounting concepts aggregate over the population a/o the whole life-course, we expect that these errors cancel out. The cross-sectional correspondence between published aggregate profiles, the weighted sum of dis-aggregated profiles, and simulated aggregates was validated.
4.1. Sustainability Indicators: Support Ratio and Impact Index
One of the most widely used indicator in NTA literature is the Support Ratio, i.e. the number of effective producers per effective consumer determined by the population age distribution and the age profiles of per capita consumption and labor income as observed today (Lee & Mason 2014). It refines the simple demographic dependency ratio by accounting for the age profiles of consumption and labor. As an index set to 1 in the base year, the measure shows the change in the relationship between available labor to the current level of consumption in absence of economic growth or changes in the age profiles of consumption and labor. As depicted in Figure 3, basing projections on dis-aggregate NTAs lead to a less pronounced decline of the Support Ratio, a result mainly driven by the educational expansion, higher educated people providing more labor input.
The Impact Index proposed by Lee & Mason (2017) further accounts for changes in wages resulting from the changing labor supply in relation to capital due to demographic change. It measures the change in the relationship between consumption and the current consumption level. As in ageing societies – based on aggregated NTA data – labor becomes scarcer, wages increase, softening the consequence of ageing on future consumption. Calculation of the Impact Index requires a simple economic growth model based on a Cobb Douglas production function without economic growth. Initial capital by age is calculated indirectly from the age shape of capital income assuming an initial interest rate (3% in our example). The resulting capital endorsement by age is assumed to stay constant, with wages and interest rates adapting to population change (assuming a closed economy). In Figure 3 we depict the Impact Index comparing simulations based on aggregated versus dis-aggregated NTA data. Due to the higher labor input accounting for the changing educational composition - and thus a lower impact of population ageing on wages - the difference between the two indices disappears when using dis-aggregated NTA data.
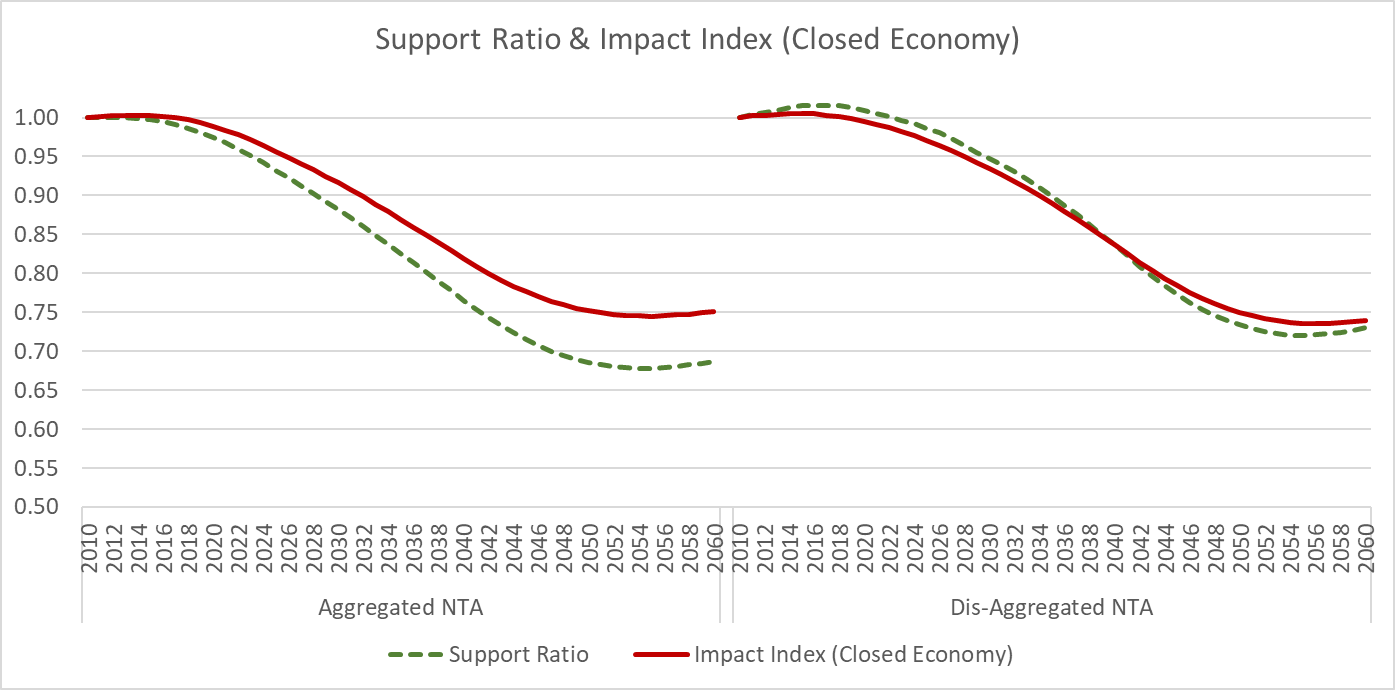 Figure 2: MicroWELT simulation projections of support ratios and the impact index by calendar year.
4.2. Net Present Value of Public Transfers
Following the approach developed in Lee et. al. (2017) for studying the intergenerational dimension of transfers further requires an assumption on economic growth and on an appropriate discount factor. Like in the original study, we use a discount factor of 3% and set the economic growth to 1.5% per year. Before adjustments for balancing budget, all incomes and transfers are assumed to grow at the same rate.
Figure 4 depicts the net present value (NPV) at birth of public transfers. Without adjustments of taxes and benefits to balance budgets, the NPV of public transfers amounts to 15% of the present value (PV) of the labor income of a cohort. For a 2011 birth cohort, disaggregation of NTAs has only a small effect on this measure, but calculating the NPV by education group, we see that the NPV expressed as percentage of the PV of labor income is about double as high for the lower two education groups compared to the high education group. As in Lee et. al. (2017) we assume a symmetric adjustment of transfers for balancing budgets each year; i.e., taxes are increased by the same extent as benefits are decreased. After this yearly adjustment, the NPV turns negative. Using aggregated NTA data, the NPV for a 2011 birth cohort is still close to 0 for the 2011 birth cohort but further decreases for a 2040 birth cohort. Using dis-aggregated NTA data, the effect is more dramatic.
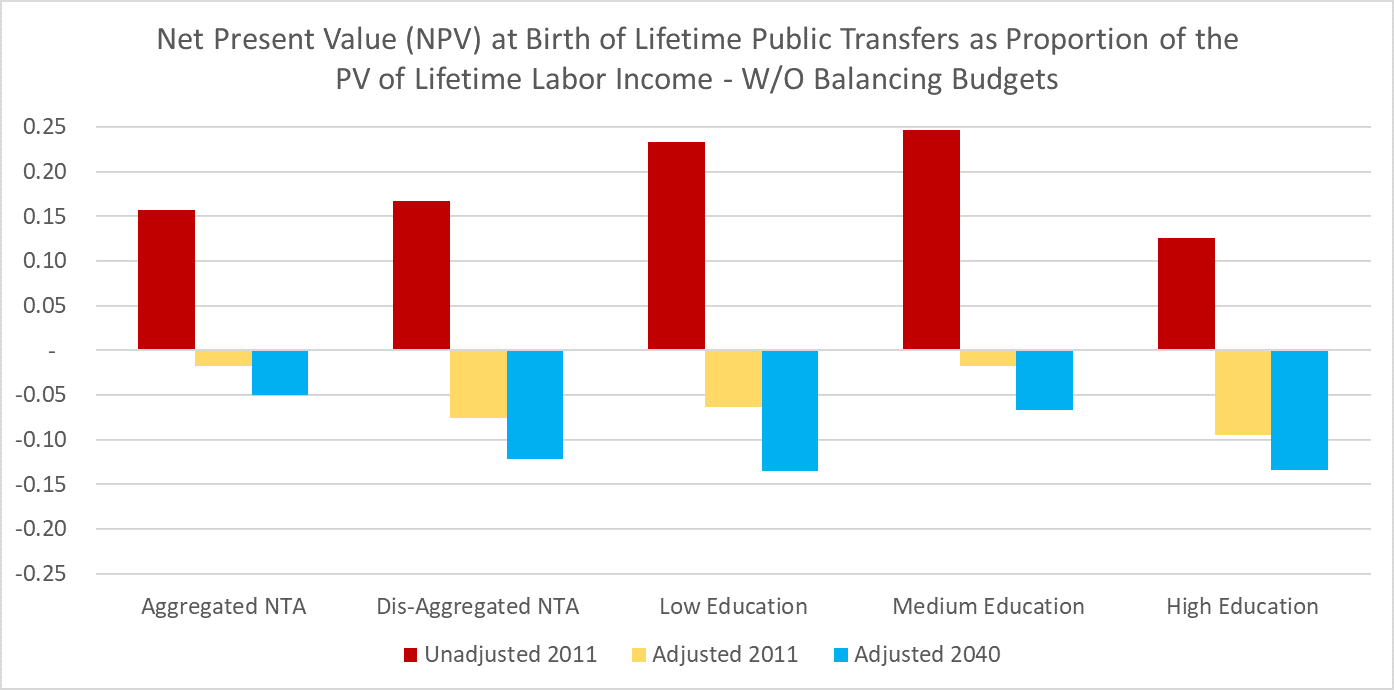 Figure 3: Net Present Value of public transfers
Patterns vary by education, the low education group being most hit by the adjustments. In the presence of mortality differentials by education, we can expect an increase of average pensions as those with the higher pensions on average live longer. Consequently, a higher adjustment of public transfers is required to balance budgets, which negatively affects all education groups.
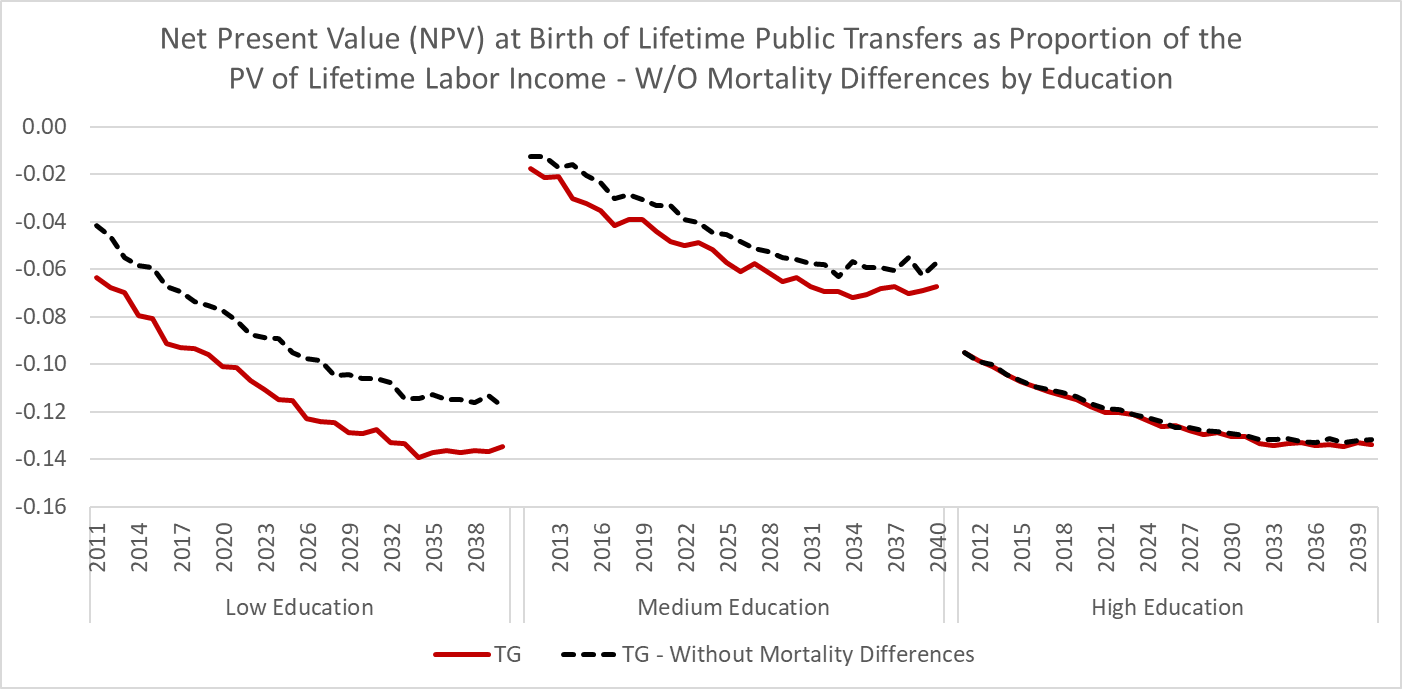 Figure 4: The effect of mortality differences by education on the NPV of public transfers
For the lower educated group, shorter life and the required additional adjustments have a negative impact on the NPV of public transfers. For the high education group, longer lives and additional adjustments have opposite effects. Running a scenario without mortality differences shows that effects cancel themselves out in the high education group, while the low educated group loses more than 2% of the PV of lifetime labor income.
4.3. Summary and Outlook
The presented first results for Spain only cover a part of the aspired strengths of MicroWELT which can be summarized by four key dimensions:
First, MicroWELT provides a tool for adding detail to existing NTA based projections for the study of redistributive patterns between education groups, accounting for longevity and fertility differentials by education. Detail refer to both the aggregation level of NTA data, but also the support of realistic country-specific mechanisms of balancing budgets. While we limited the presented analysis to public transfers, the NTA approach – and MicroWELT - allow for analysis of intra- and inter household transfers giving a more complete picture of redistributive mechanisms. A second related concept complementing the NTA approach are National Time Transfer Accounts (NTTA) which will be incorporated into the model.
Second, MicroWELT provides a tool supporting comparative studies. While the project focuses on four country examples representing four welfare state regimes (Austria, Finland, the UK, and Spain) the model is easily portable to many European countries.
Third, MicroWELT provides a modeling platform extendable for a wide range of applications going beyond the NTA approach, e.g. by explicit modeling of policies and behaviors, like labor market participation and earnings, enabling distributional analysis also within the NTA population groups.
Finally, MicroWELT aims at complementing (and communicating with) EUROMOD.