Chapter 7: Generational Accounts
This chapter is organized as a self-contained paper:
Spielauer, Martin, Thomas Horvath, Marian Fink, Gemma Abio, Guadalupe Souto Nieves, Concepció Patxot, Tanja Istenič (2020) microWELT: Microsimulation Projection of Full Generational Accounts for Austria and Spain WIFO Working Paper 618/2020 pdf
Abstract
This paper studies the effect of population ageing on the inter- and intra-generational redistribution of income from a longitudinal perspective, comparing lifetime measures of income and transfers by generation, gender, education and family characteristics. For this end, we incorporate new disaggregated National Transfer Account (NTA) data and concepts of generational accounting into the dynamic microsimulation model microWELT. This bottom-up modelling strategy makes it possible to project, for each generation and sociodemographic group, the net present value of expected transfers. microWELT delivers detailed sociodemographic projections consistent with Eurostat population projections but additionally providing the required detail concerning the changes in the population composition by education and family characteristics. Also, the model allows incorporating mechanisms to balance budgets over time in response to population ageing. Our study compares the results for Spain and Austria. We find significant differences in the role of private and public transfers related to parenthood. While in both countries parents privately transfer substantially more money to others, the Austrian welfare state fully compensates for these differences through public transfers to parents. Such compensation is not observed in Spain.
Keywords: Microsimulation, Education, Demographic Change, National Transfer Accounts JEL: E01, J11, P51, O57, C53
This paper is part of the WELTRANSIM project, a project of the Horizon 2020 Joint Program Initiative More Years, Better Live’s second joint transnational call entitled Welfare, Wellbeing and Demographic Change: Understanding Welfare Models (weltransim.eu). Authors thank Meritxell Solé for technical assistance in the earlier phase of the project. They also thank Risto Vaittinen for providing consumption data for Finland.
Introduction
There exists an extensive literature on projection models assessing the budgetary impact and redistributive consequences of population ageing. Models vary according to their focus, some concentrating on specific public expenditure, e.g. pensions, while others aim at capturing welfare states in their entirety. Models can be theoretical or applied. They can follow a top-down (macro) or a bottom-up (micro) approach. Prominent examples of macro models are general equilibrium models, most importantly, overlapping generation (OLG) models, based on micro fundamentals, where individuals make optimal choices regarding labour and saving. At the other end, microsimulation models are based on detailed micro-data, reproducing observed behaviour by statistical modelling, rather than being based on optimisation. A typical trade-off lies in consistency versus applicability. OLG models allow a consistent capture of the general equilibrium effects of demographic change. In contrast, microsimulation models are typically chosen whenever redistribution is particularly relevant to the research question.
A third type of models located somewhere in the middle on this bottom-up – top-down continuum are aggregated accounting models. In this framework, within the literature on dynamic fiscal policy, the Generational Accounting technique was proposed by Auerbach, Gokhale, and Kotlikoff (1991) as an applied technique derived from OLG models. (The technique was designed in a partial equilibrium setting, though the indicators proposed can also be com-puted in general equilibrium. See Bonin (2001) and Bonin and Patxot (2004) for a survey focused on Generational Accounting and related techniques.)
The primary purpose of the standard method was evaluating the extent to which the intertemporal budget constraint of the public sector holds under the current fiscal policy. In other words, whether a debt accumulated in the base year would be covered by the payments (net of transfers) to be made by current and future generations, keeping the current policies. The estimation procedure starts from the aggregate net payments of living generations obtained by imputing the base year budget aggregates by age and gender. The assumption of a constant fiscal policy allows these payments to be maintained constant for future generations and hence, the implicit debt/wealth is obtained as the intertemporal debt not covered by net payments of any generation. This stylised and transparent model structure gave way to develop internationally comparable studies of welfare state sustainability (Auerbach et al., 1999; European Commission, 1999).
The age profiles of taxes and transfers estimated as an input to derive the Generational Accounting projections were an – unintentional – precedent of National Transfer Accounts (NTA). NTAs were proposed in Population Economics (Lee et al., 2003; Lee & Mason, 2004; Mason et al., 2006; UN, 2013; Istenič et al., 2016) to obtain a comprehensive measure of the inter-age reallocation of income. To that end, the method disaggregates the System of National Accounts (SNA) into age profiles reflecting tax incidence and transfer receipts, including also an estimation of private transfers by age. NTAs share some essential elements with Generational Accounting. In particular, the age profiles of taxes and transfers employed as inputs in Generational Accounting are similar to some of the NTA’s outputs. The former is mainly a projection method, while the latter offers more detailed information on age reallocations from a cross-section observation. Nevertheless, NTAs have been used to feed projection models looking at the past and future evolution of the interaction between economic and demographic change.
microWELT benefits from both approaches. By employing dynamic microsimulation techniques, it introduces a novel approach in this literature which to date is dominated by aggregate accounting by age and gender. Previous efforts combining Generational Accounting and NTA have been made in the past (see Patxot et al., 2011, 2012; Romero et al., (2019); Lee et al., 2017). Our work is more related to the latter but adds rich detail to the analysis, as it captures sociodemographic changes beyond age. To perform this analysis, we apply newly available NTA data by level of education and family type (Abio et al., 2020). In this way, we obtain complete generational accounts for living and future generations that distinguish between educational levels and family types. This paper is part of a series of related papers and other resources which together build comprehensive documentation and presentation of the research performed developing and using microWELT. All materials are available at the model (www.microWELT.eu) and the project website (www.weltransim.eu). Related papers provide a thorough description of the different aspects of the methodology employed. Spielauer et al. (2020a) discusses the design and structure of the microWELT model. Spielauer et al. (2020b) explains how the parameters determining the main sociodemographic transitions such as education, fertility and partnership formation have been estimated for the four countries simulated in the project. Abio et al. (2020) explains in detail how the disaggregated National Transfer Accounts by education level and family type have been obtained and how they are used as parameters in the model. Spielauer et al. (2020c) focuses on the outcomes of the model at the macro level, showing the resulting evolution of the aggregate sustainability indicators as the population ages. This paper focuses on the results regarding the lifetime transfer payments and receipts of successive cohorts distinguishing between educational level and parenthood status. The rest of this contribution is organised as follows. Section 2 gives more details on the methodology and Section 3 on the data employed. Section 4 shows the results and the final section concludes.
Combining Generational Accounting and National Transfers Accounts
Generational Accounting was proposed in the 90s as a stylised projection technique to evaluate the public budget’s sustainability. The standard method combines population projections with the age profiles of tax payments and transfer receipts observed in the base year and assesses the public budget’s sustainability based on this information. As a starting point, the observed incidence of fiscal and social policy by age (the age profiles) is kept constant to estimate the net lifetime tax payments (net of transfer receipts) of living and future generations. This approach allows for estimating the intertemporal budget constraint of the public sector. By equating the initial stock of debt to future deficits/surpluses coming from the net taxes paid by all generations alive and not-yet-born, the equation’s residual measures the implicit debt (or wealth) associated with the current fiscal and social policy. This procedure allows for obtaining several indicators. First, the present value of the intertemporal debt measured this way is related to the future expected present value of GDP, obtaining the so-called sustainability gap. Second, in order to measure intergenerational income redistribution, the net present value of the net taxes paid by the current generations (called the Generational Account, GA) is compared to the one corresponding to the future generations adjusted to wipe out the implicit debt. More specifically, the GA for the generation born in the base year – the only living generation observed during his entire lifetime – is compared to the GA of the generation born the year after, representative of all future generations, adjusted once and for all, in order to meet the intertemporal budget constraint of the public sector.
This analysis, while providing an interesting picture, ignores the evolution of private transfers. The National Transfer Accounts project addresses this omission. It develops a method to estimate the age profiles of income, public and family transfers, saving and consumption patterns consistent with National Accounts aggregates. Hence, they reflect both the size and aggregate pattern of welfare state transfers, together with the corresponding private reallocation occurring in each economy. In the WELTRANSIM project, we further disaggregate NTA variables by education and family type (see the next section) which are incorporated as inputs in the microWELT simulation model. This approach allows to model composition effects beyond the age composition of the population. The simulations are performed applying the microWELT microsimulation model developed alongside the WELTRANSIM project (Spielauer et al., 2020a, 2020b). microWELT implements the NTA accounting framework, introducing a higher level of disaggregation by education level and family type, and projecting the sociodemographic change at the required level of detail. Furthermore, it obtains indicators in the logic of Generational Accounting. In this sense, this paper is inspired by Lee et al. (2017), who combine standard GA with standard aggregate NTA. As in Lee et al. (2017), we deviate from standard Generational Accounting in the following dimensions. First, we project to the future not only public transfers and taxes but also the private side of the economy, including consumption, income, and private transfers. Second, we balance the budget in each future year (following a pay-as-you-go logic), adjusting both taxes and transfers proportionally, contrary to the standard procedure that adjusts taxes and/or benefits once and for all to all future generations. Because of this difference, we will compare GA for currently living generations and new-borns not only to the generation born the year after but also to the following other generations. Summarising, our study contributes to the existing literature in various dimensions:
- Being based on disaggregated NTAs, it adds realism to existing projections by accounting for essential composition effects concerning education and family characteristics. We demonstrate that taking these effects into account, measures of the effects of population ageing change considerably.
- Being based on disaggregated NTAs, it also adds a distributional dimension (within generations) to the study of transfers. Specifically, we are interested in transfer flows between education groups and between parents versus childless persons.
- The microsimulation approach enables us to study the effect of life expectancy differentials by education on transfer flows.
- Microsimulation also enables us to go beyond the simple assumptions of how budgets are balanced in the future, as applied in Lee et al. (2017), who use a fifty-fifty approach reducing all benefits by the same amount as contributions are raised. The goal, as more countries are simulated, is to link balancing mechanisms to welfare state regimes, accounting for the transfer type and socio-economic characteristics of affected population groups.
Disaggregated NTA data
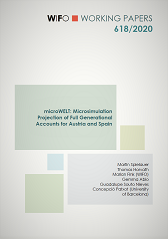
Our analysis uses new NTA estimates by educational level and family type developed in the WELTRANSIM project. We distinguish three levels of education: Low (ISCED 0-2), Medium (ISCED 3-4), and High (ISCED 5+). Family types are constructed according to partnership status and the presence of dependent children in the family (up to age 59) and childlessness (for ages 60+). Dependent children are children up to age 16 and students up to 25 if living with parents. Figure 1 illustrates the NTA age profiles of labour income and total consumption by education (for children and students up to 25, education refers to parents’ education). As expected, labour income is concentrated in working ages, whereas differences by education can be observed. High educated people reach higher incomes, especially later in their work career, and they remain in the labour market until a higher age. Regarding consumption, the age profiles are much smoother, and the differences between education groups are less pronounced. Adult people in the high education group consume around 50% more than those in the lowest. Interestingly, consumption profiles are flatter when using aggregate NTA data, whereas disaggregated by education, these profiles increase over age. This effect is a consequence of the different educational compositions in the various age groups. It illustrates one of the problems of applying the current aggregated cross-sectional profiles to the future.
Figure 1: NTA age profiles of labour income and consumption. Simulation output based on NTA data by education and family type developed in the WELTRANSIM project
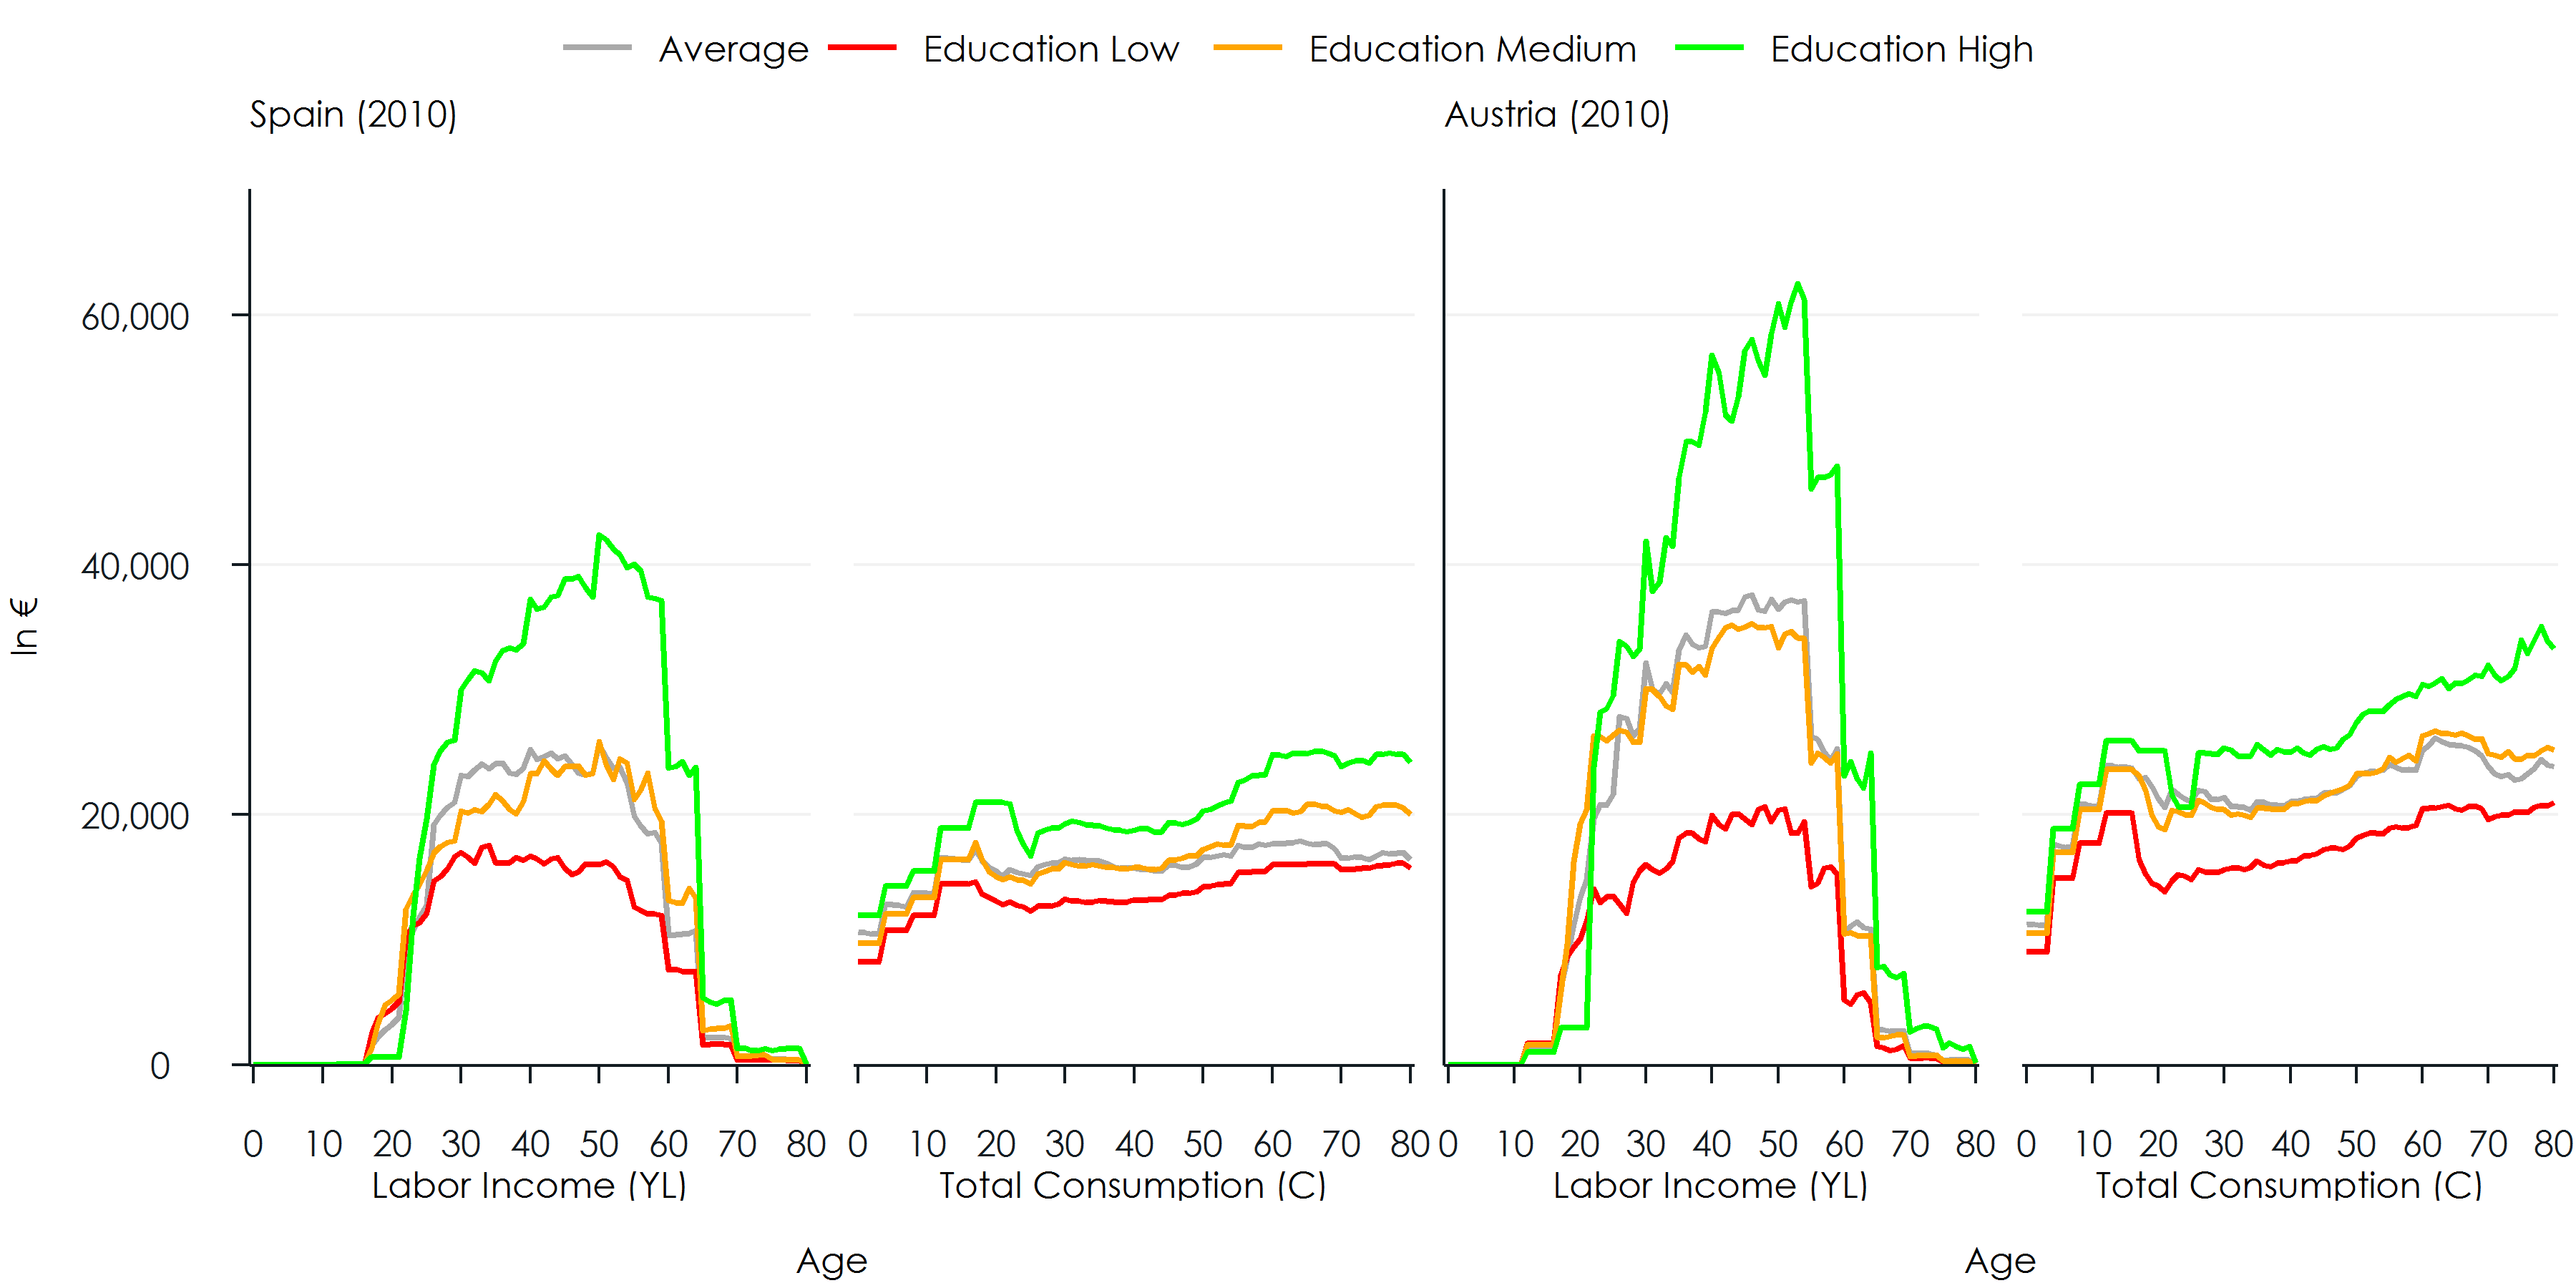 Figure 1
The difference between labour income and consumption results from transfers – both private and public – and asset reallocations (asset income minus dissaving). Figure 2 depicts the age profiles of private and public net transfers by education.
Figure 2: NTA age profiles of public and private net transfers. Simulation output based on NTA data by education and family type developed in the WELTRANSIM project
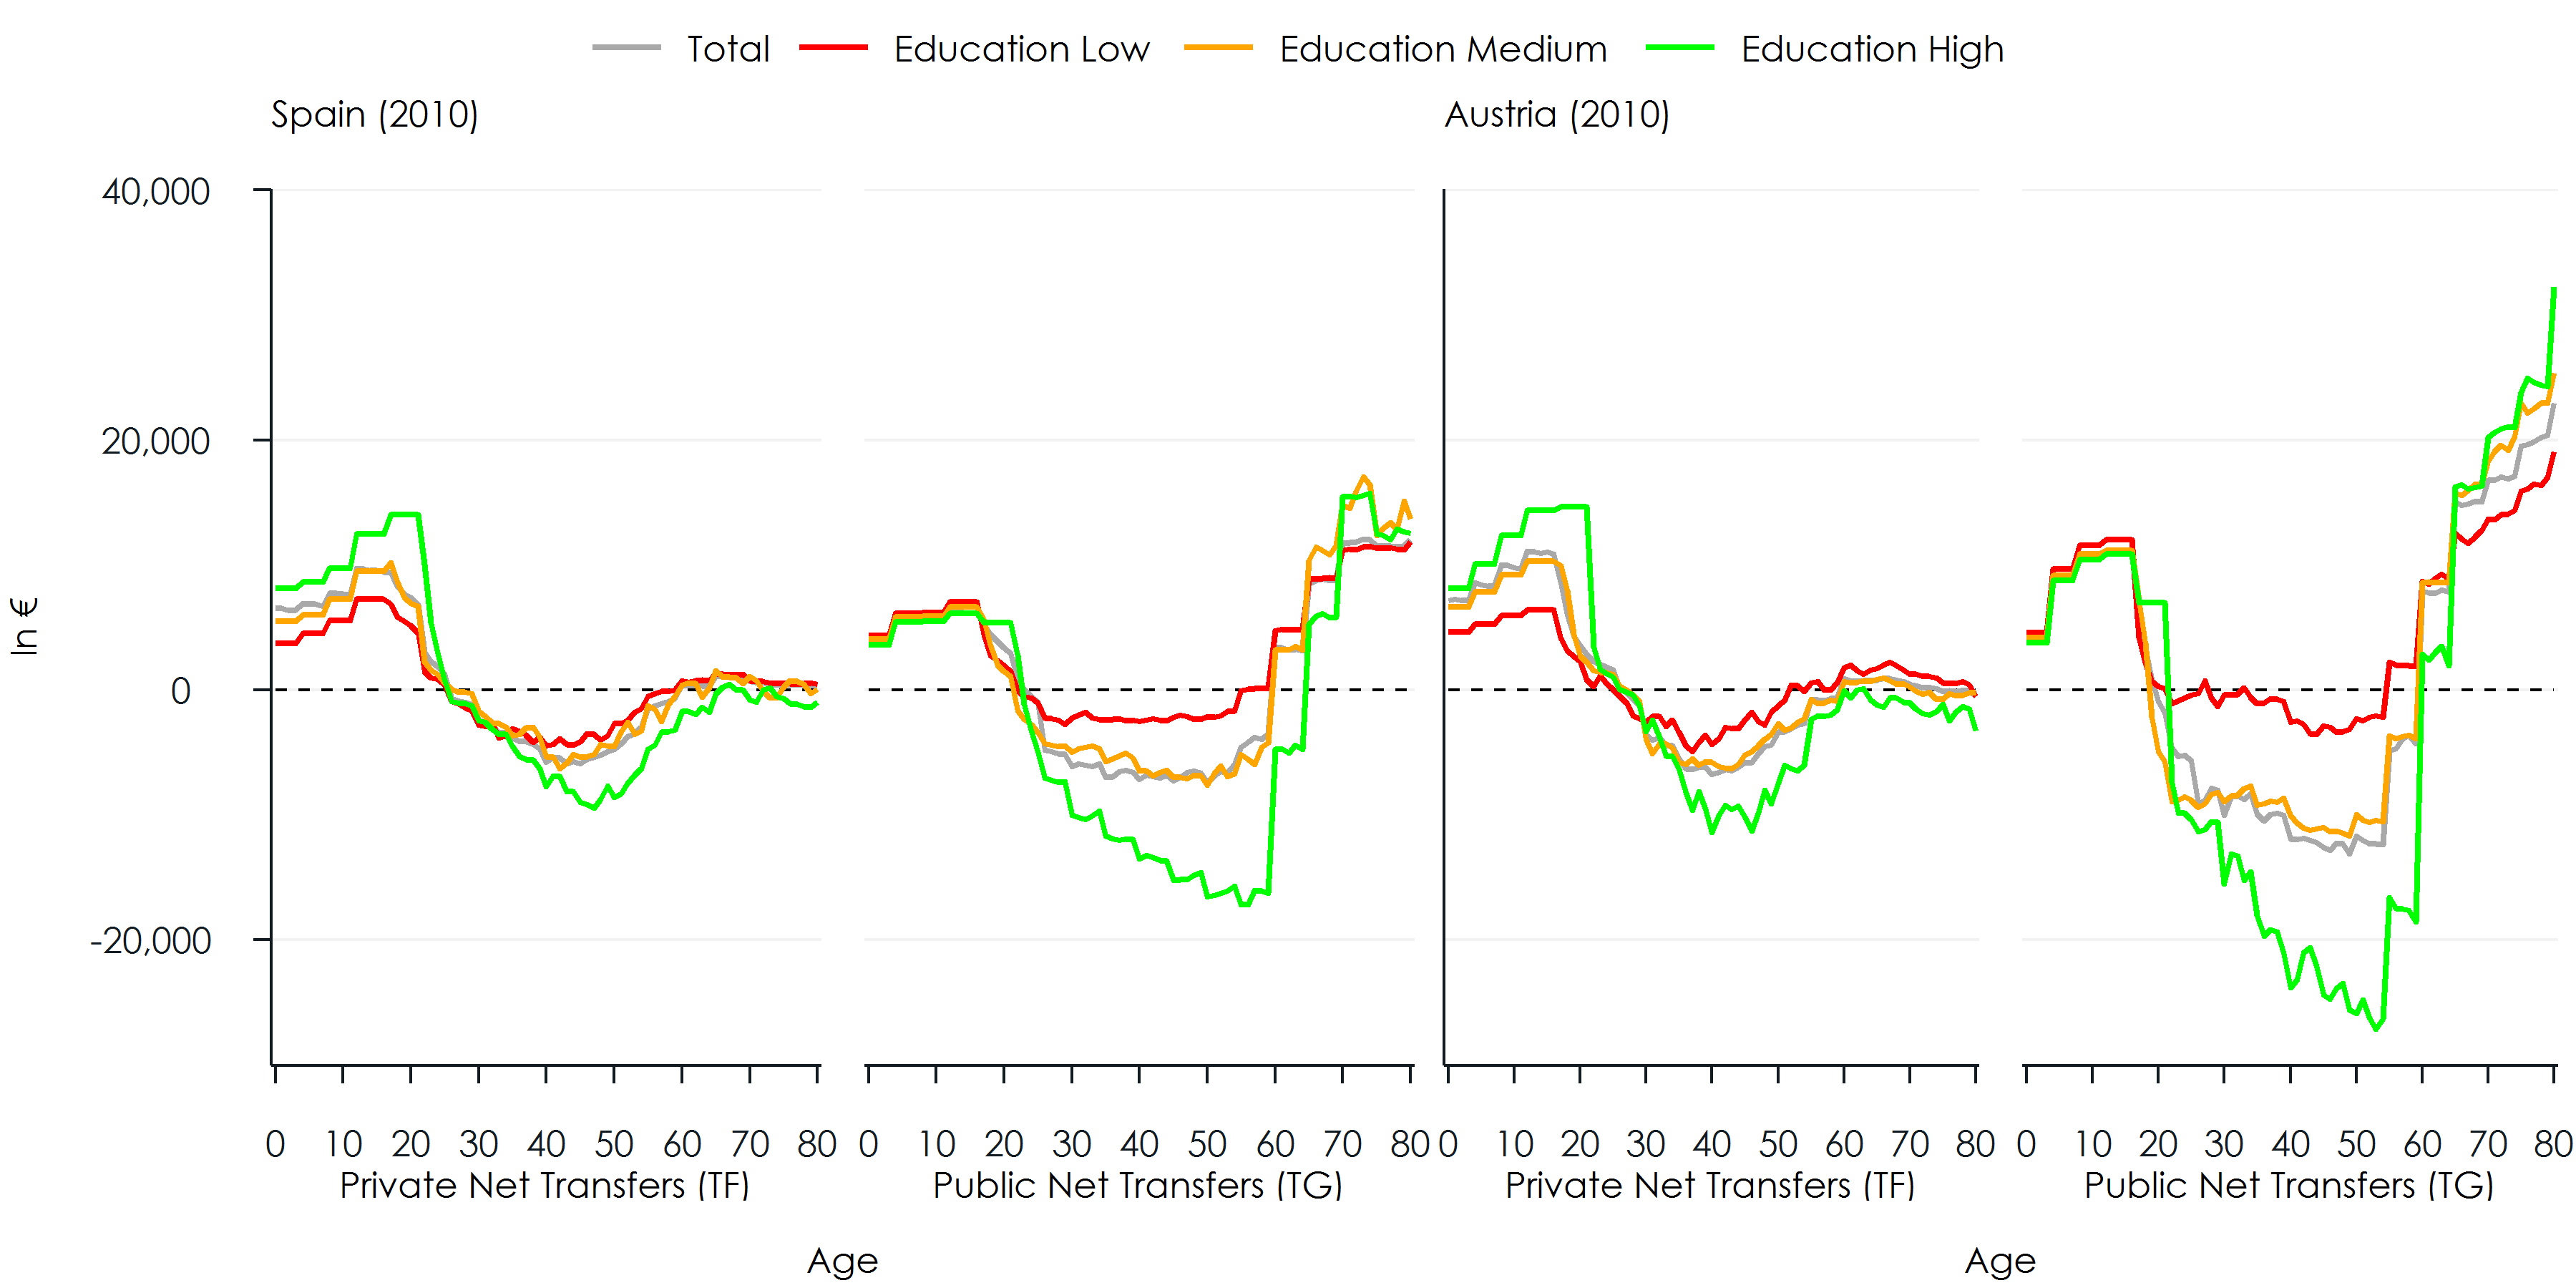 Figure 2
A comparison between the transfers in Spain and Austria reveals similar patterns and absolute magnitudes (in €) for family transfers; in relative terms, given the lower labour income in Spain, family transfers are higher than in Austria. However, public transfers are higher in Austria in absolute terms, the difference being in the range of differences in labour income between the two countries. Differences by education are very pronounced – notably in magnitude but also somehow in shape – especially regarding public net transfers.
Results on intra- and intergenerational income redistribution
In the following, we use the approach developed in Lee et al. (2017) for studying the intergenerational dimension of both family and public transfers. Besides the NTA profiles and demographic projections, this approach requires an assumption on economic growth, to project future transfer receipts and tax payments, and an appropriate discount factor to value future flows in the present. Like in the original study, we use a discount factor of 3% and set the economic growth rate to 1.5%. Before applying adjustments to balance the budget, all incomes and transfers are assumed to grow at the same rate.
Figure 3 depicts the net present value (NPV) of net public transfers at birth, which is equivalent, with the opposite sign, to the Generational Account (net taxes) of the representative individual of future generations – born right after the base year. Without adjustments of taxes and benefits for balancing budgets, the NPV of public transfers is positive in both countries, meaning that, on average, individuals are net receivers of public transfers. The average value amounts to around 15% of the present value (PV) of the labour income of a cohort in both countries, being slightly higher in Spain. For the 2011 birth cohort, disaggregation of NTAs has only a small negative effect on this measure in Austria but reduces the average NPV by one third in Spain. Calculating the NPV by education group, we see that expressed as a percentage of the PV of labour income; it far exceeds this average for the low education group. At the same time, net transfers are far smaller in the Spanish case – close to zero for the high education group.
In the next step, we adjust all transfers in a way that balances the budget each year. As in Lee et al. (2017), we assume a symmetric adjustment; i.e., in order to prevent a deficit, taxes are increased to the same extent as benefits are reduced. After this adjustment, both based on aggregated or disaggregated NTA data, the NPV of lifetime public transfers received by the 2011 birth cohort is close to zero in both countries, and it turns negative for the 2040 birth cohort. Again, there is a strong education gradient.
Figure 3: Net Present Value (NPV) of public transfers
 Figure 3
Note: Net present value (NPV) at birth of lifetime public transfers as proportion of the present value of lifetime labour income – W/O balancing budgets.
Figure 3
Note: Net present value (NPV) at birth of lifetime public transfers as proportion of the present value of lifetime labour income – W/O balancing budgets.
As explained above, Lee et al. (2017) extends the analysis of the Generational Accounts (or NPV of public transfers) also to private transfers (TF). Consistent with their findings (for the US and Taiwan), the NPV of private transfers in Austria and Spain is – and stays – positive for future cohorts; thus, each cohort privately receives more than it gives. This is true even in the case when TF are adjusted in the future to close the gap between future needs and transfers. Figure 4 depicts, by birth cohorts, the NPVs of the (adjusted) public and private transfers, as well as total transfers. Based on aggregated NTA data, the NPVs of total transfers – while decreasing over time – stay positive, indicating that when accounting for private transfers, also future cohorts receive more than they give over life. Recall that the age shape of private transfers (see Figure 2) implies that transfers mainly go from parents in working-age to young children. On the contrary, the adjusted value of average public transfers starts near zero and decreases steadily to -0.5% or even more in the case of disaggregated NTA.
Figure 4: Net present value of public, private and total transfers by birth cohort
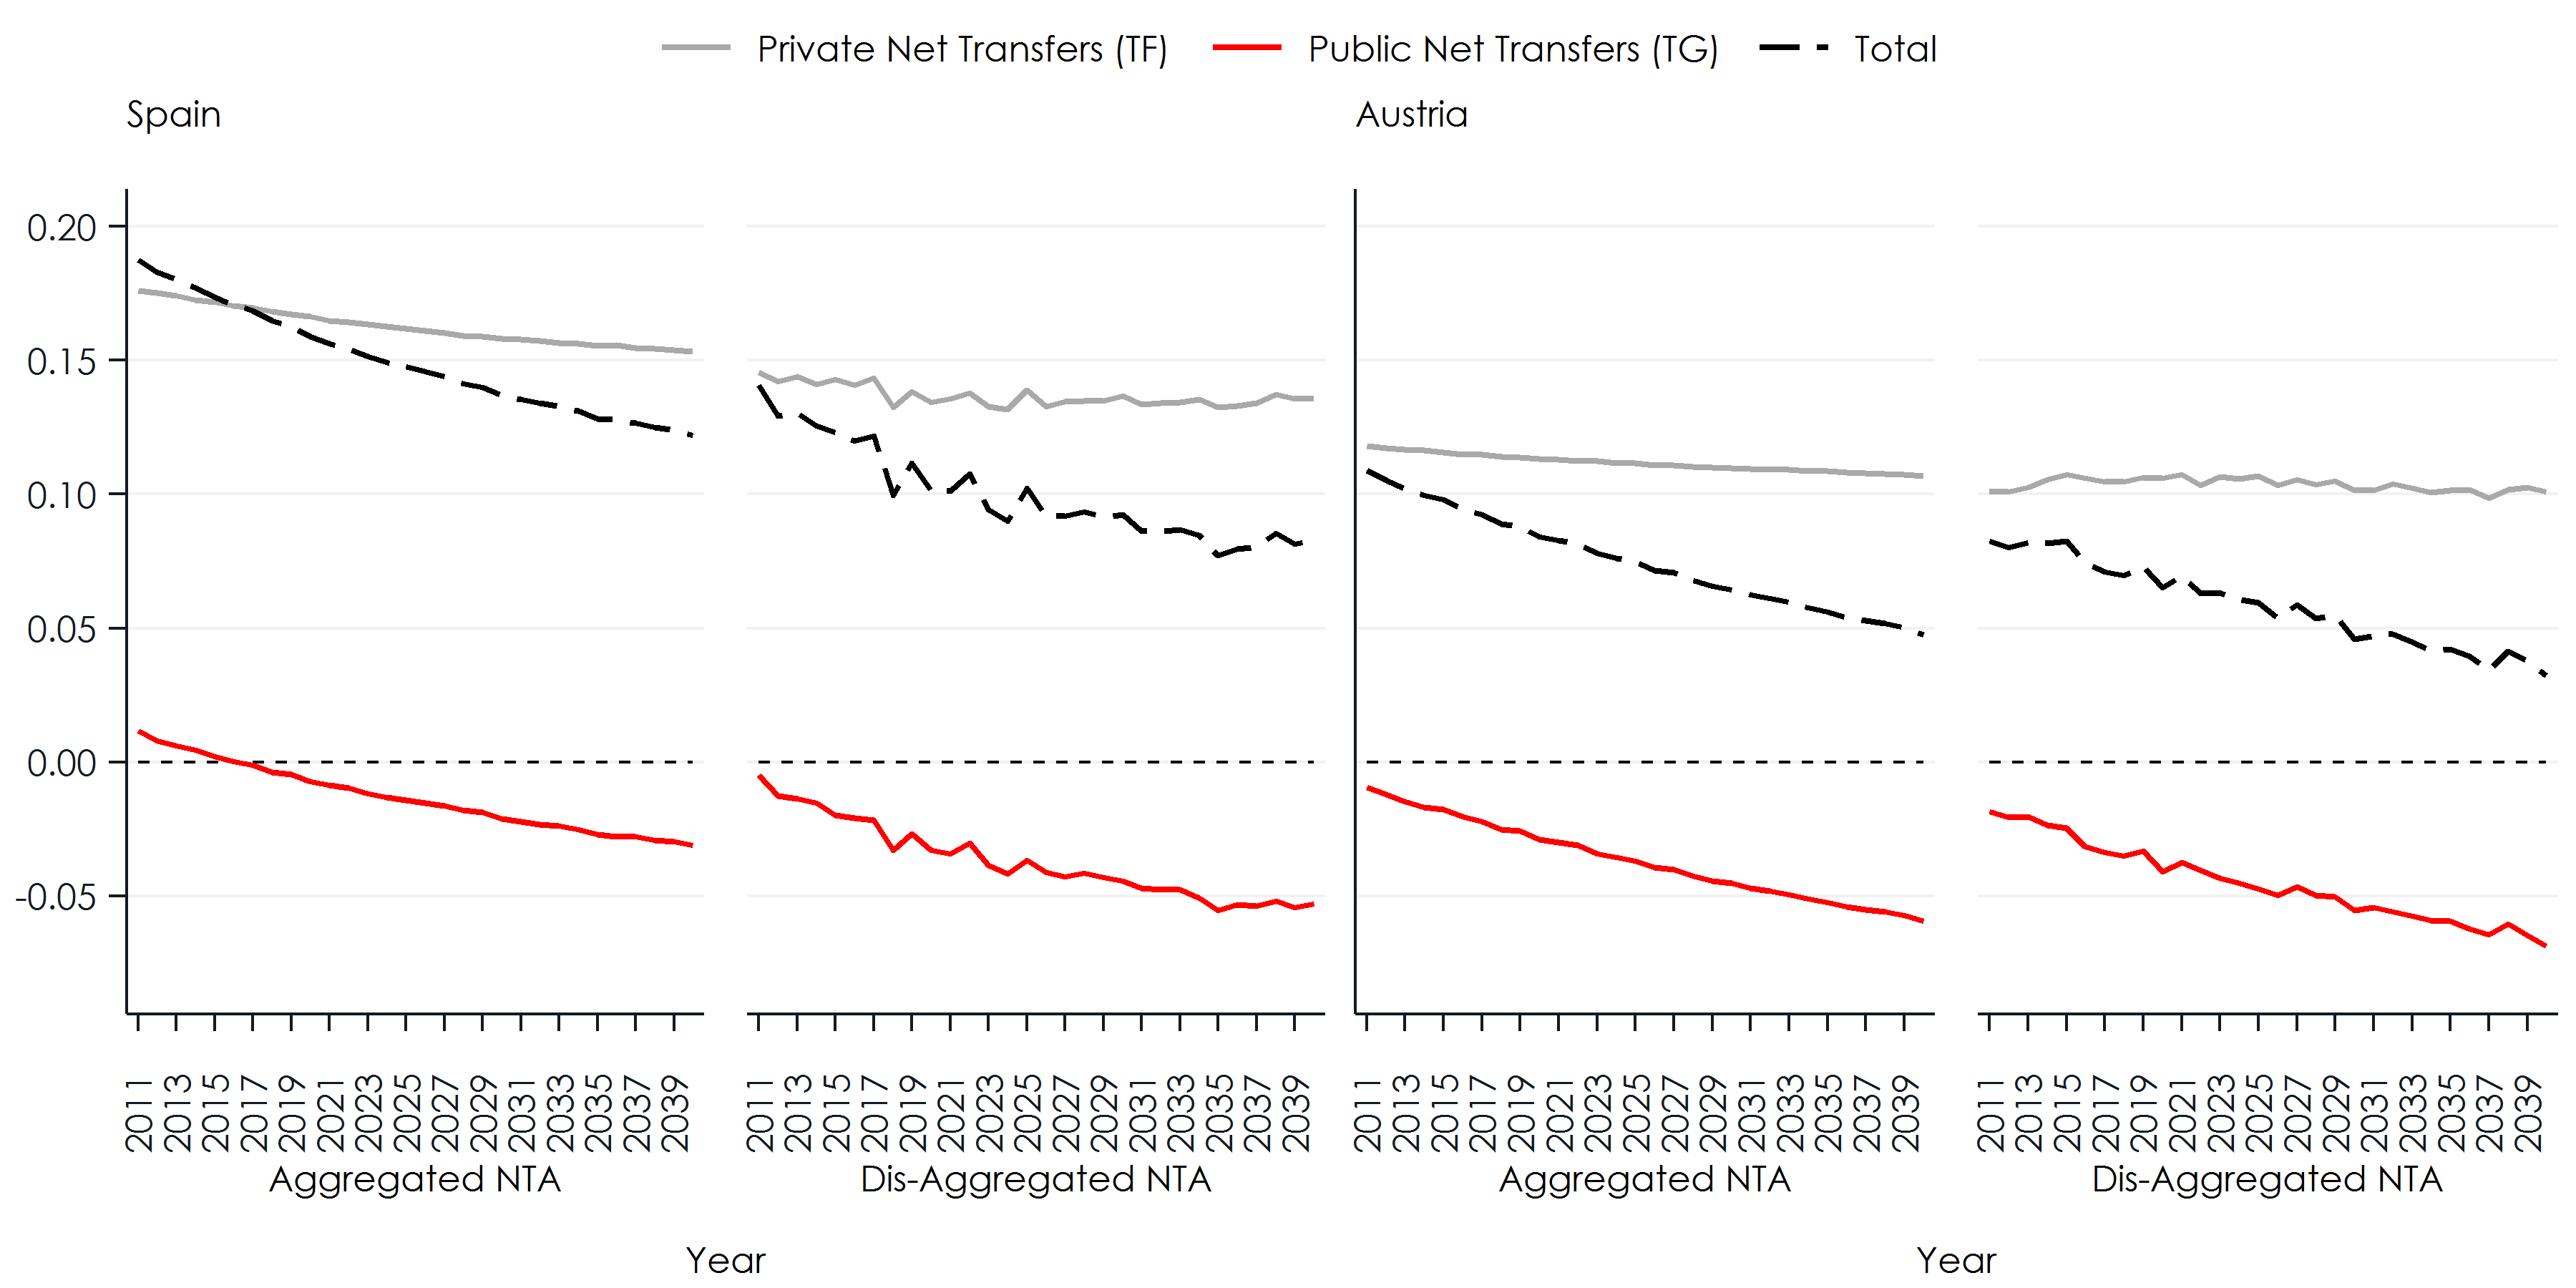 Figure 4
Note: Net present value at birth of lifetime of public, private and total transfers as proportion of the present value of lifetime labour income.
Figure 4
Note: Net present value at birth of lifetime of public, private and total transfers as proportion of the present value of lifetime labour income.
Figure 5 shows the same measures distinguishing by education level. As already seen in Figure 3, the initial values for cohorts born in 2011 differ substantially by education level – from 40% for low educated in Austria (30% in Spain) to -10% for high educated in both countries. This difference persists over time, while all public transfers decrease becoming almost negative for the medium education level in Austria. Interestingly, the adjustment of private transfers is more limited, first, because of their shape, being strongly positive for the old, which is the age group growing most. Moreover, because families necessarily need to balance their budget.
Figure 5: Net present value of public, private and total transfers by birth cohort and education
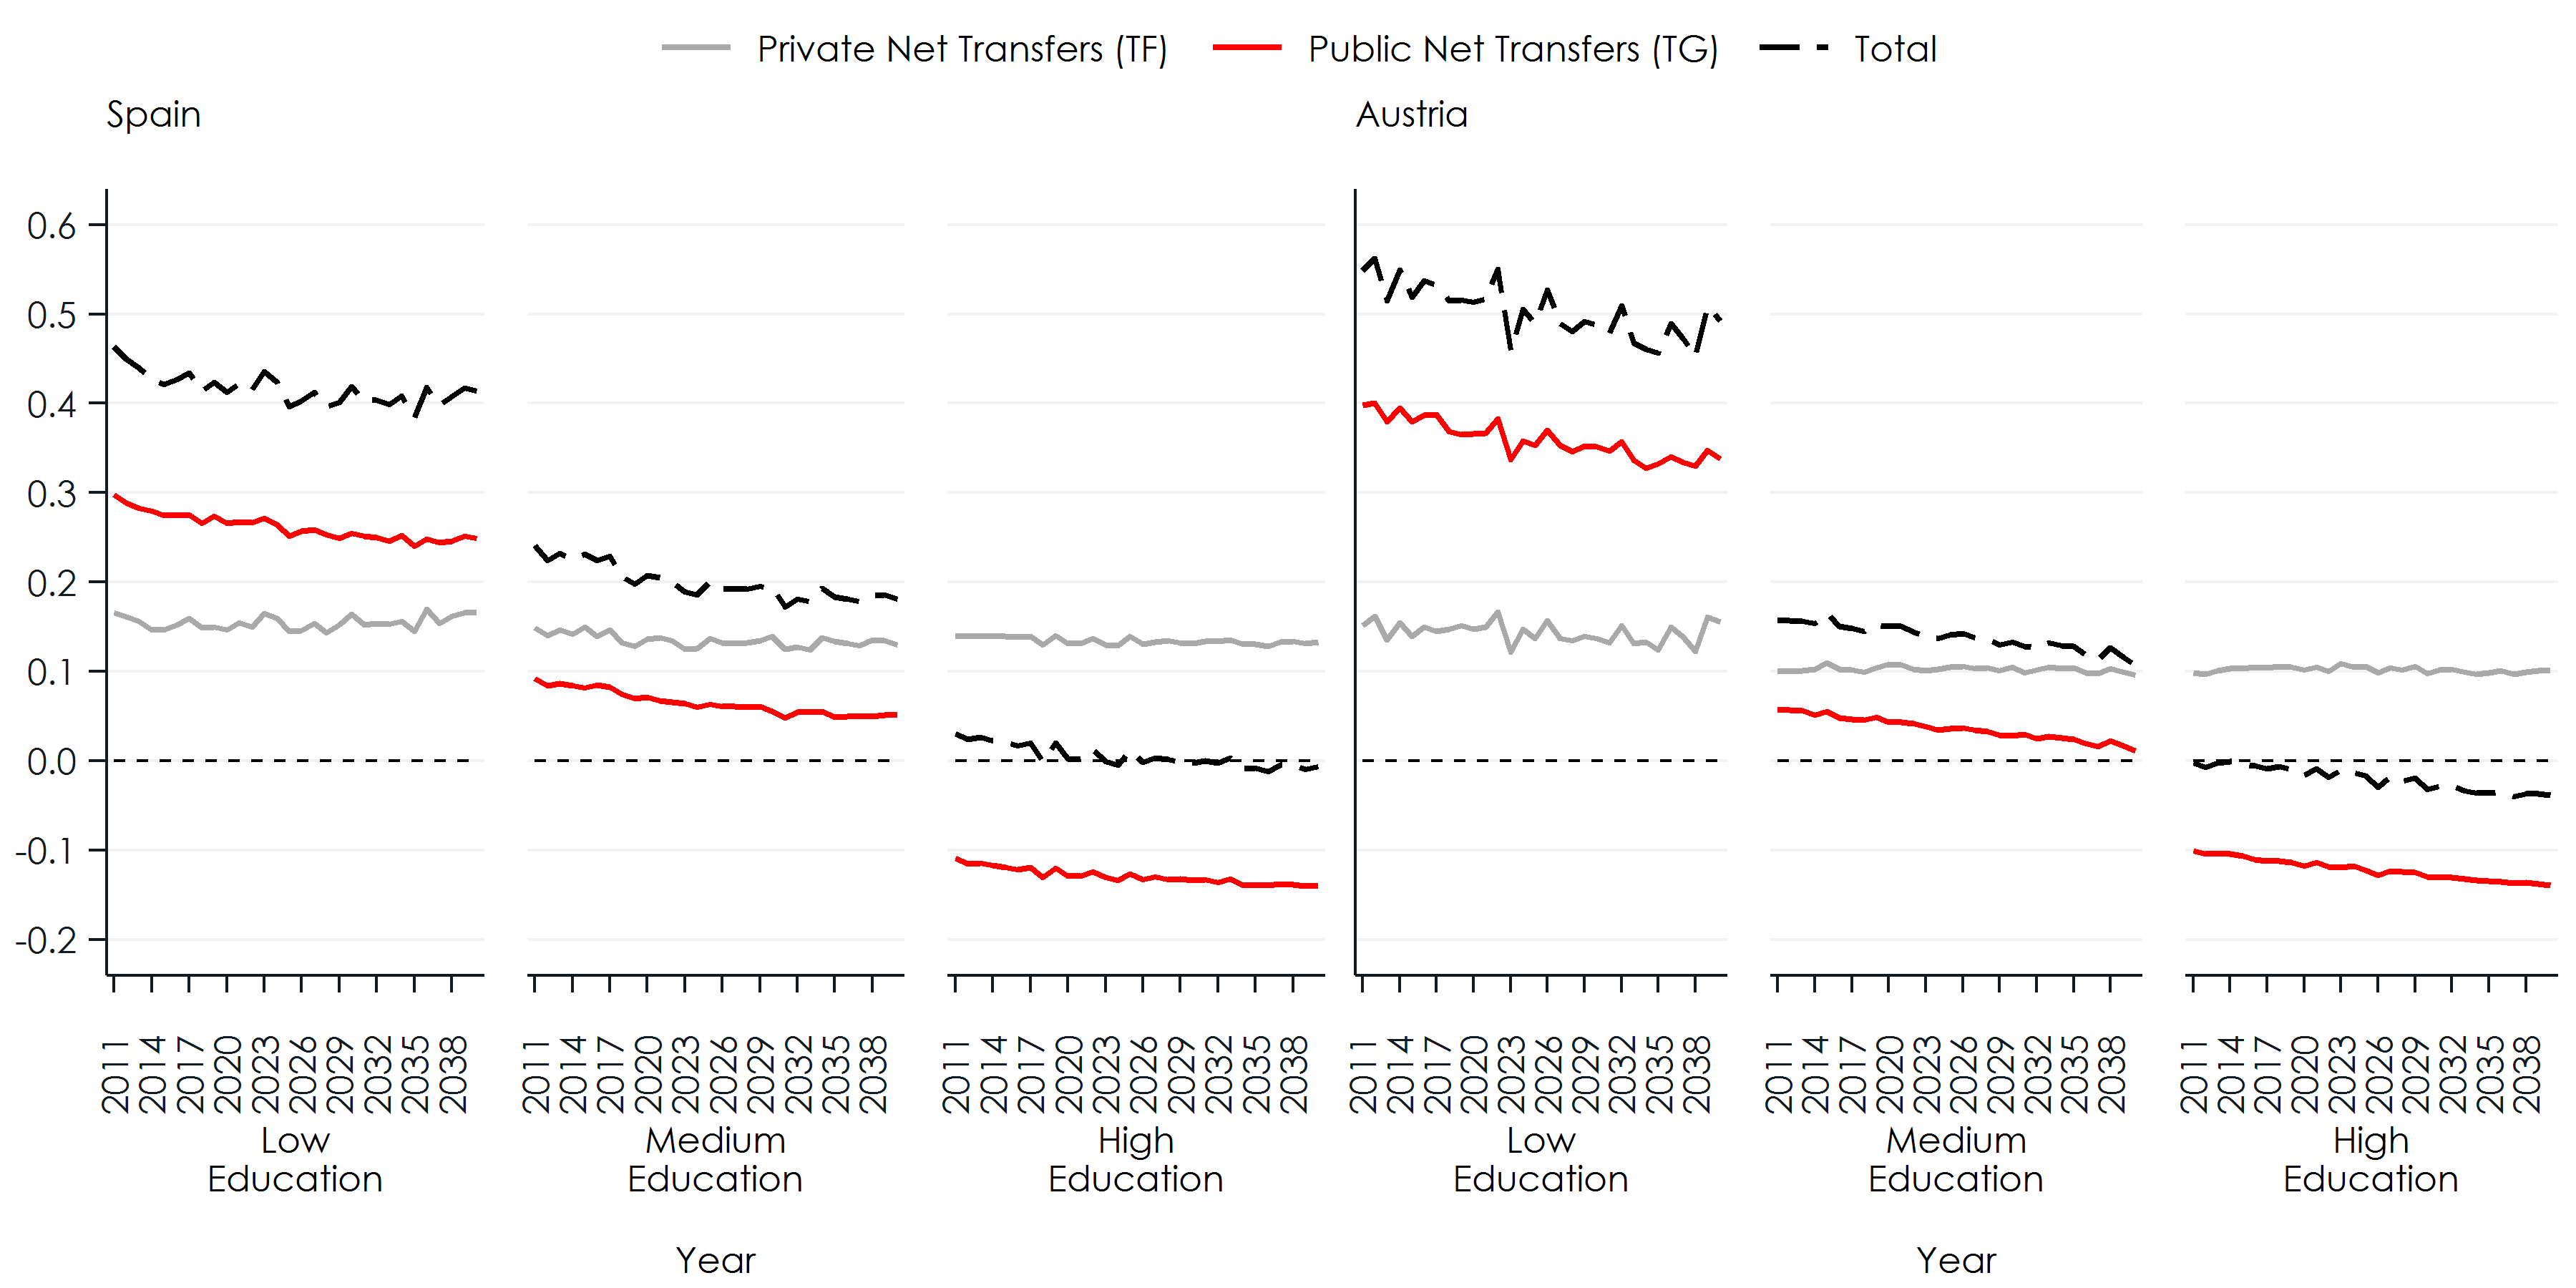 Figure 5
Note: Net present value at birth of lifetime of public, private and total transfers as proportion of the present value of lifetime labour income.
Figure 5
Note: Net present value at birth of lifetime of public, private and total transfers as proportion of the present value of lifetime labour income.
In the presence of mortality differentials by the level of education, we can expect an increase in average pensions, as those with higher pensions, on average, live longer. As a consequence, a higher adjustment of public transfers is required to balance budgets, which negatively affects all education groups. For the less educated, both their shorter life and the required additional adjustments have a negative impact on the NPV of public transfers. For the high education group, longer lives and additional adjustments have opposite effects. Running a scenario without mortality differences shows that effects cancel out in the high education group. In contrast, the low educated group loses more than 2% of the PV of their lifetime labour income.
Figure 6: The effect of mortality differences by education on the net present value of public transfers
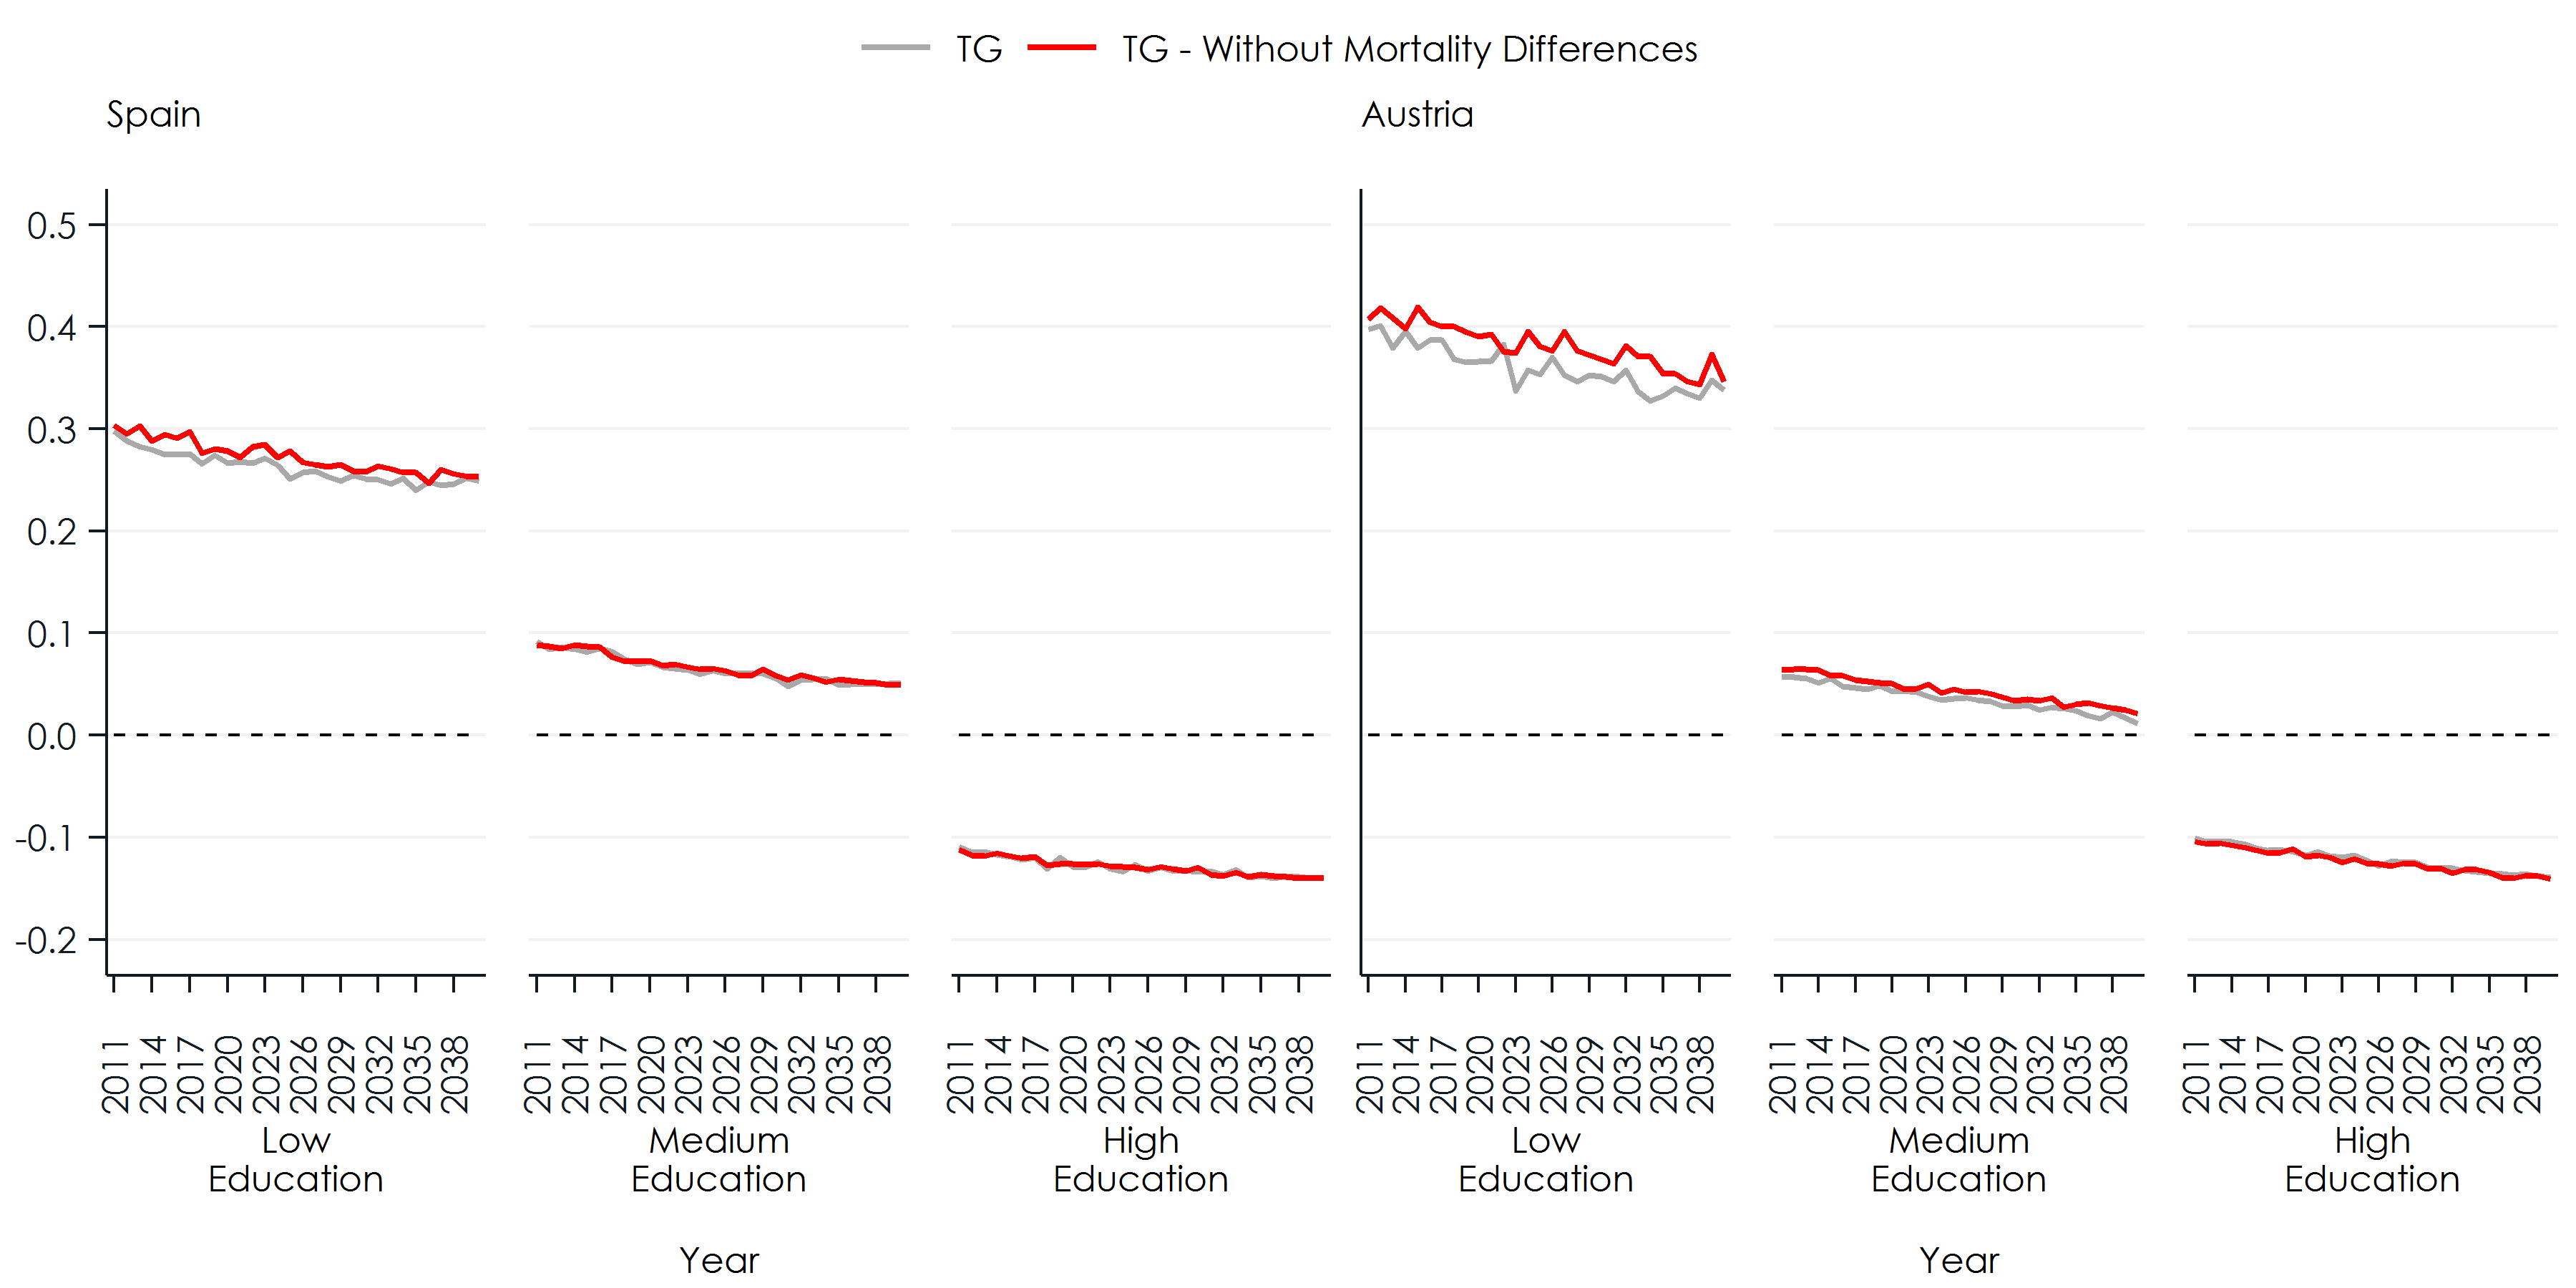 Figure 6
Note: Net present value at birth of lifetime public transfers as proportion of the present value of lifetime labour income – W/O mortality differences by education.
Figure 6
Note: Net present value at birth of lifetime public transfers as proportion of the present value of lifetime labour income – W/O mortality differences by education.
The next Figures (Figure 7 and Figure 8) show results for public and private transfers by educational level and family type. Regarding the latter, we look at the difference between parents and non-parents, the more relevant distinction among family types in our analysis given a life cycle perspective. Figure 7 shows the present value (PV) of labour income (YL) and the net present value of public (TG) and private transfers (TF). It gives the absolute value, while Figure 8 shows the relative value of NPV of transfers (both TF and TG) concerning the PV of labour income. The size of the average present value for private transfers is substantially higher than for public transfers in Spain (15% versus 9%) while both values are similar in Austria (around 13%), reflecting the substitution of private transfers by public transfers as the size of the welfare state becomes more extensive.
As expected, labour income increases with education and is higher for males (Figure 7). The gender gap is larger for parents, especially in Austria. Concerning parenthood status, labour income is always higher for parents in the case of men. This is not always the case for women, an effect probably related to their different labour force participation. In Austria, mothers always have a lower average labour income than childless women, irrespective of their level of education. However, in Spain, this only occurs for the low educated group, their weight being strong enough to affect the average mother.
Regarding public transfers (TG), it is worth mentioning that all educational levels receive net transfers, except high educated males who are net payers. In both countries, mothers receive more than childless women, especially in Austria. However, in the case of men, Austria and Spain show opposite patterns. In Austria, fathers receive slightly more (or pay less in the case of high educated), while in Spain the childless are the most benefited. In order to demonstrate this difference, Table 1 shows the NPV illustrated in Figure 6 and Figure 7 together with the disaggregated value of inflows (TGI) and outflows (TGO) for the average male. In absolute values, in both countries, fathers receive more, but also pay more, the latter partly due to their higher income. In relative terms, dividing by the PV of labour income (YL) the result reverses except for childless Austrian males, who remain unaffected. The key to understanding the differences between countries is in the last part of Table 1. It shows the ratio of PV TGI (and TGO) for fathers with respect to childless males. Spanish fathers pay almost 14% more and receive only 2.9% more, while these figures are 5.4 and 8.7% in the case of Austria. This difference means that being a father in Austria implies receiving more (actually going from net payment to net transfer), while in Spain fathers receive less than childless males from the public sector.
Finally, regarding TF in absolute terms, they are higher for childless individuals than for parents, as they receive transfers from their parents while young, but do not transfer resources to children during their working age. For Austrian females, the difference is small and reverses in relative terms. Additionally, it is worth mentioning that according to our results men give more private transfers (or become net givers) because, by assumption, in the standard NTA method only household heads (mostly men) transfer resources to other household members.
Table 1: Detailed public transfers for males by parenthood status
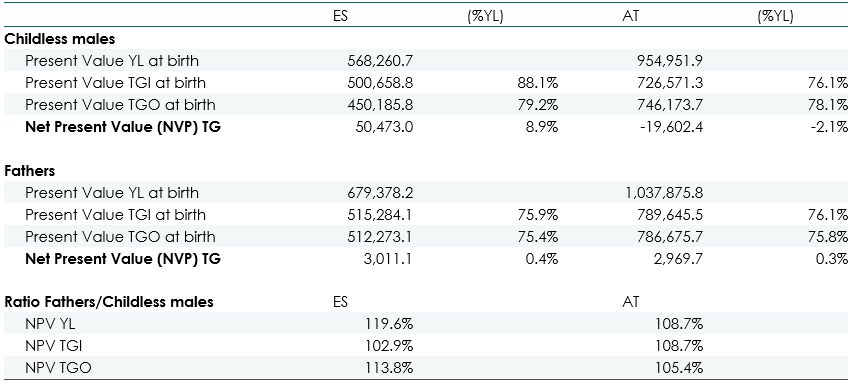 Table 1
Figure 7: Present value of labour income (YL) and net present value of private (TF) and public transfers (TG)
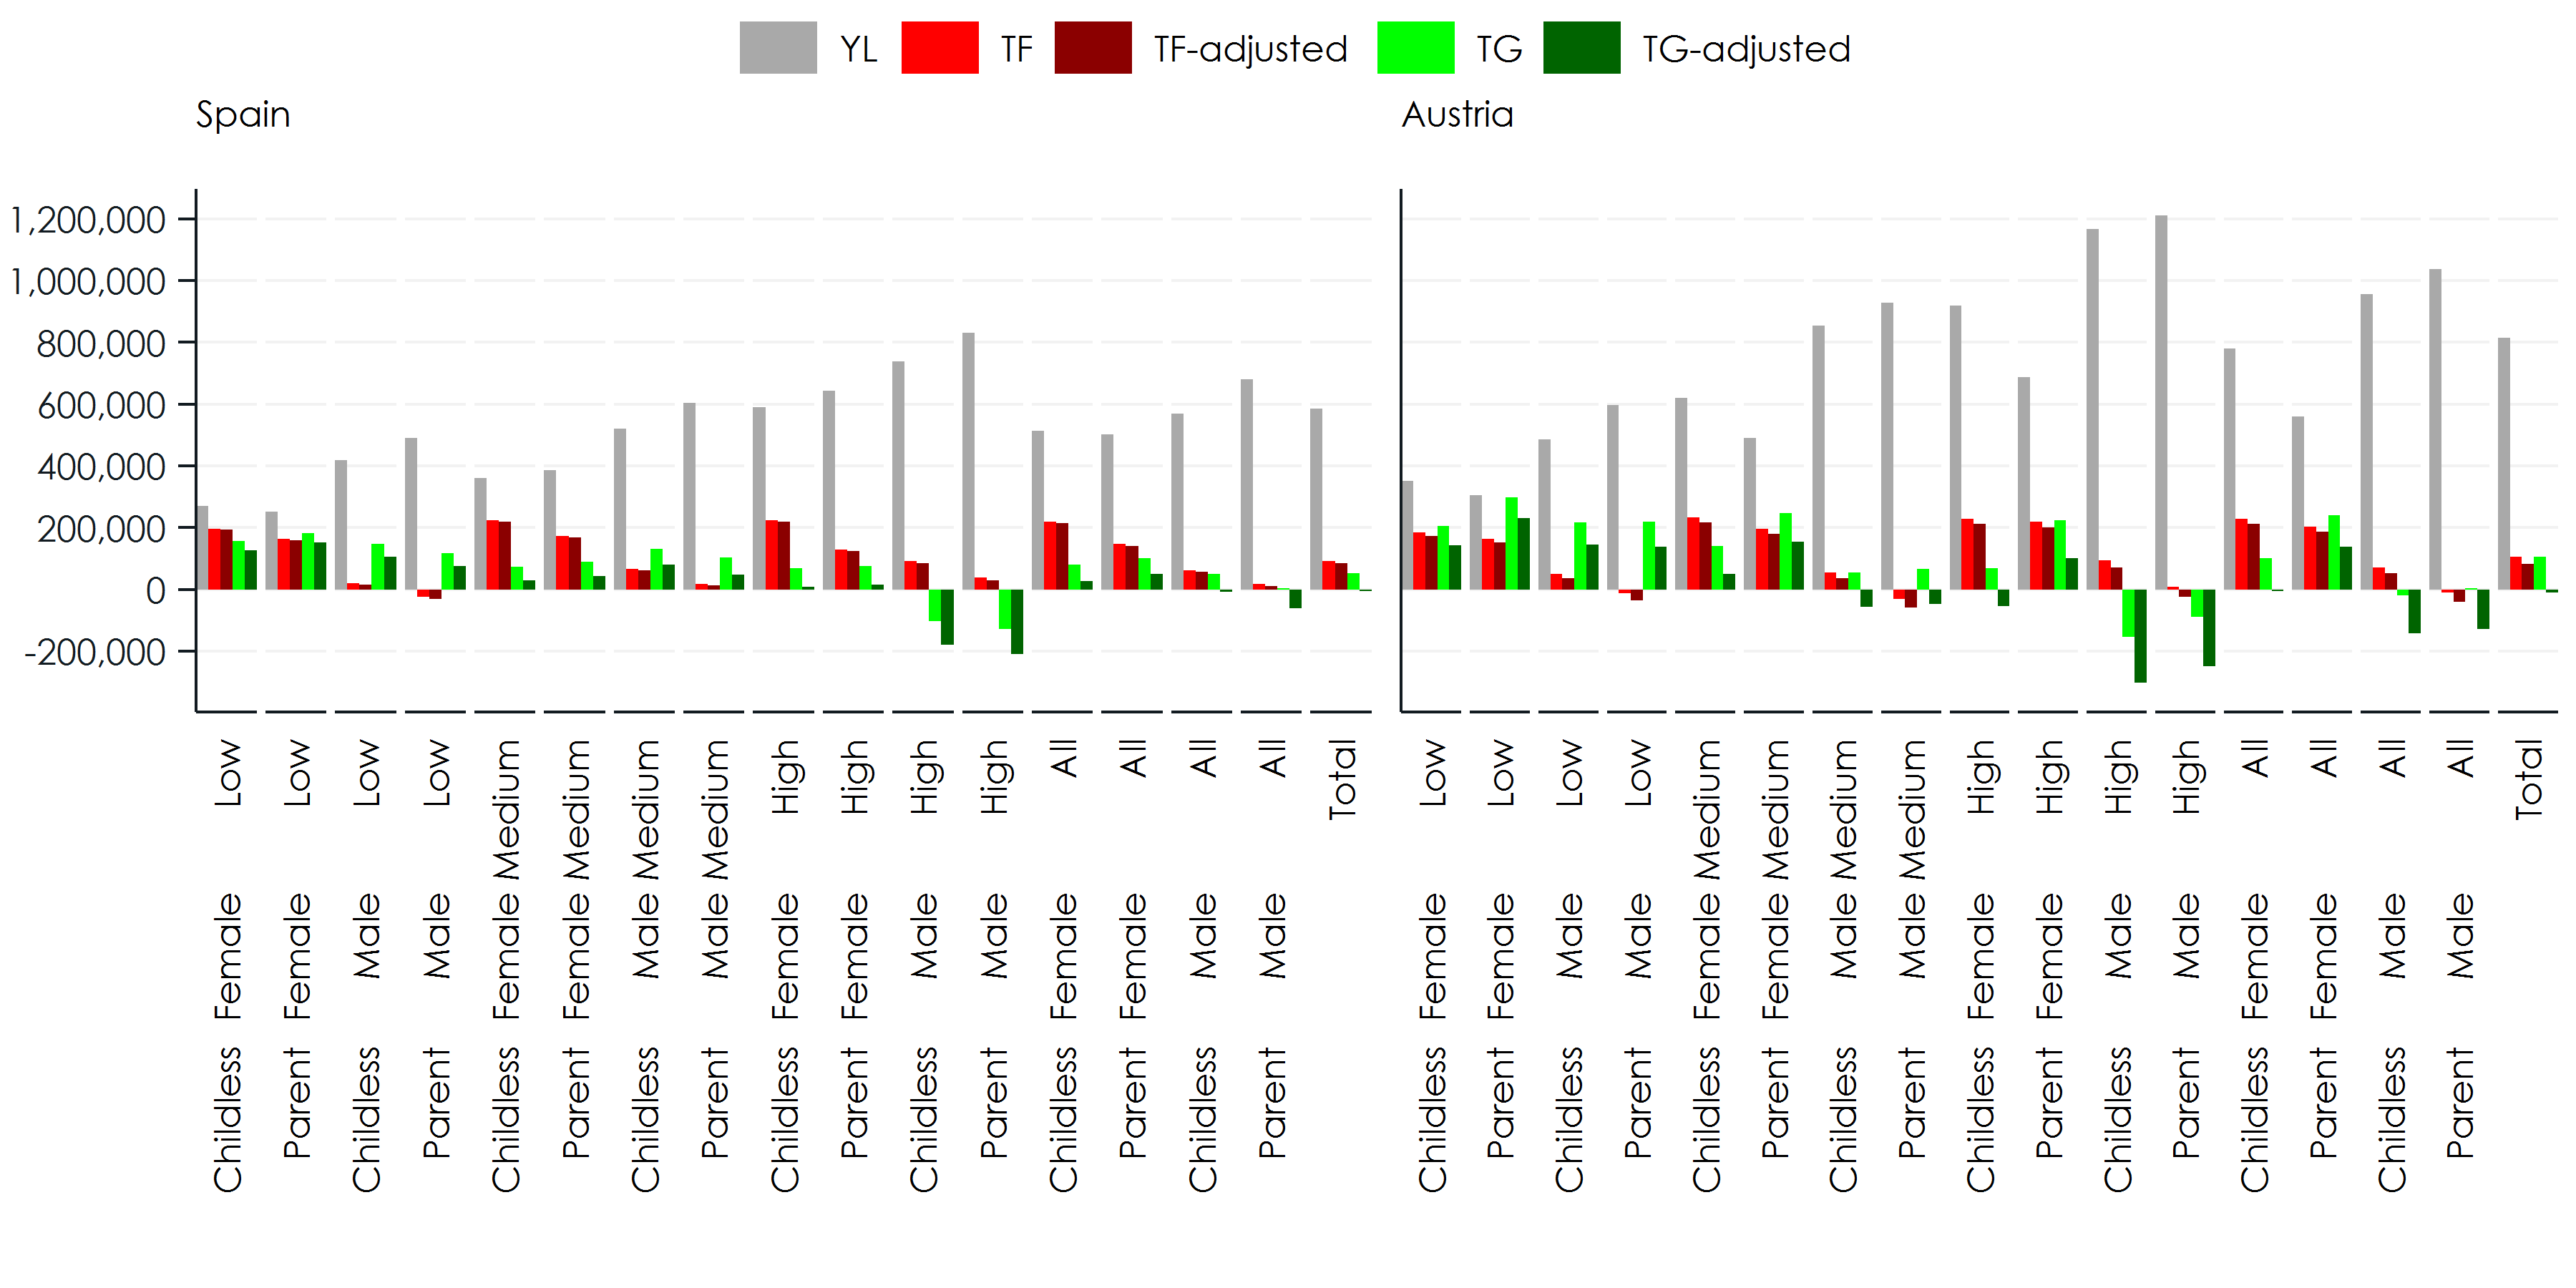 Figure 7
Note: Present value of labour income (YL), net private transfers (TF), and net public transfers (TG) W/O balancing budgets – 2010 birth cohort.
Figure 7
Note: Present value of labour income (YL), net private transfers (TF), and net public transfers (TG) W/O balancing budgets – 2010 birth cohort.
Figure 8: Net present value of transfers (TF, TG) as a share of the present value of labour income YL
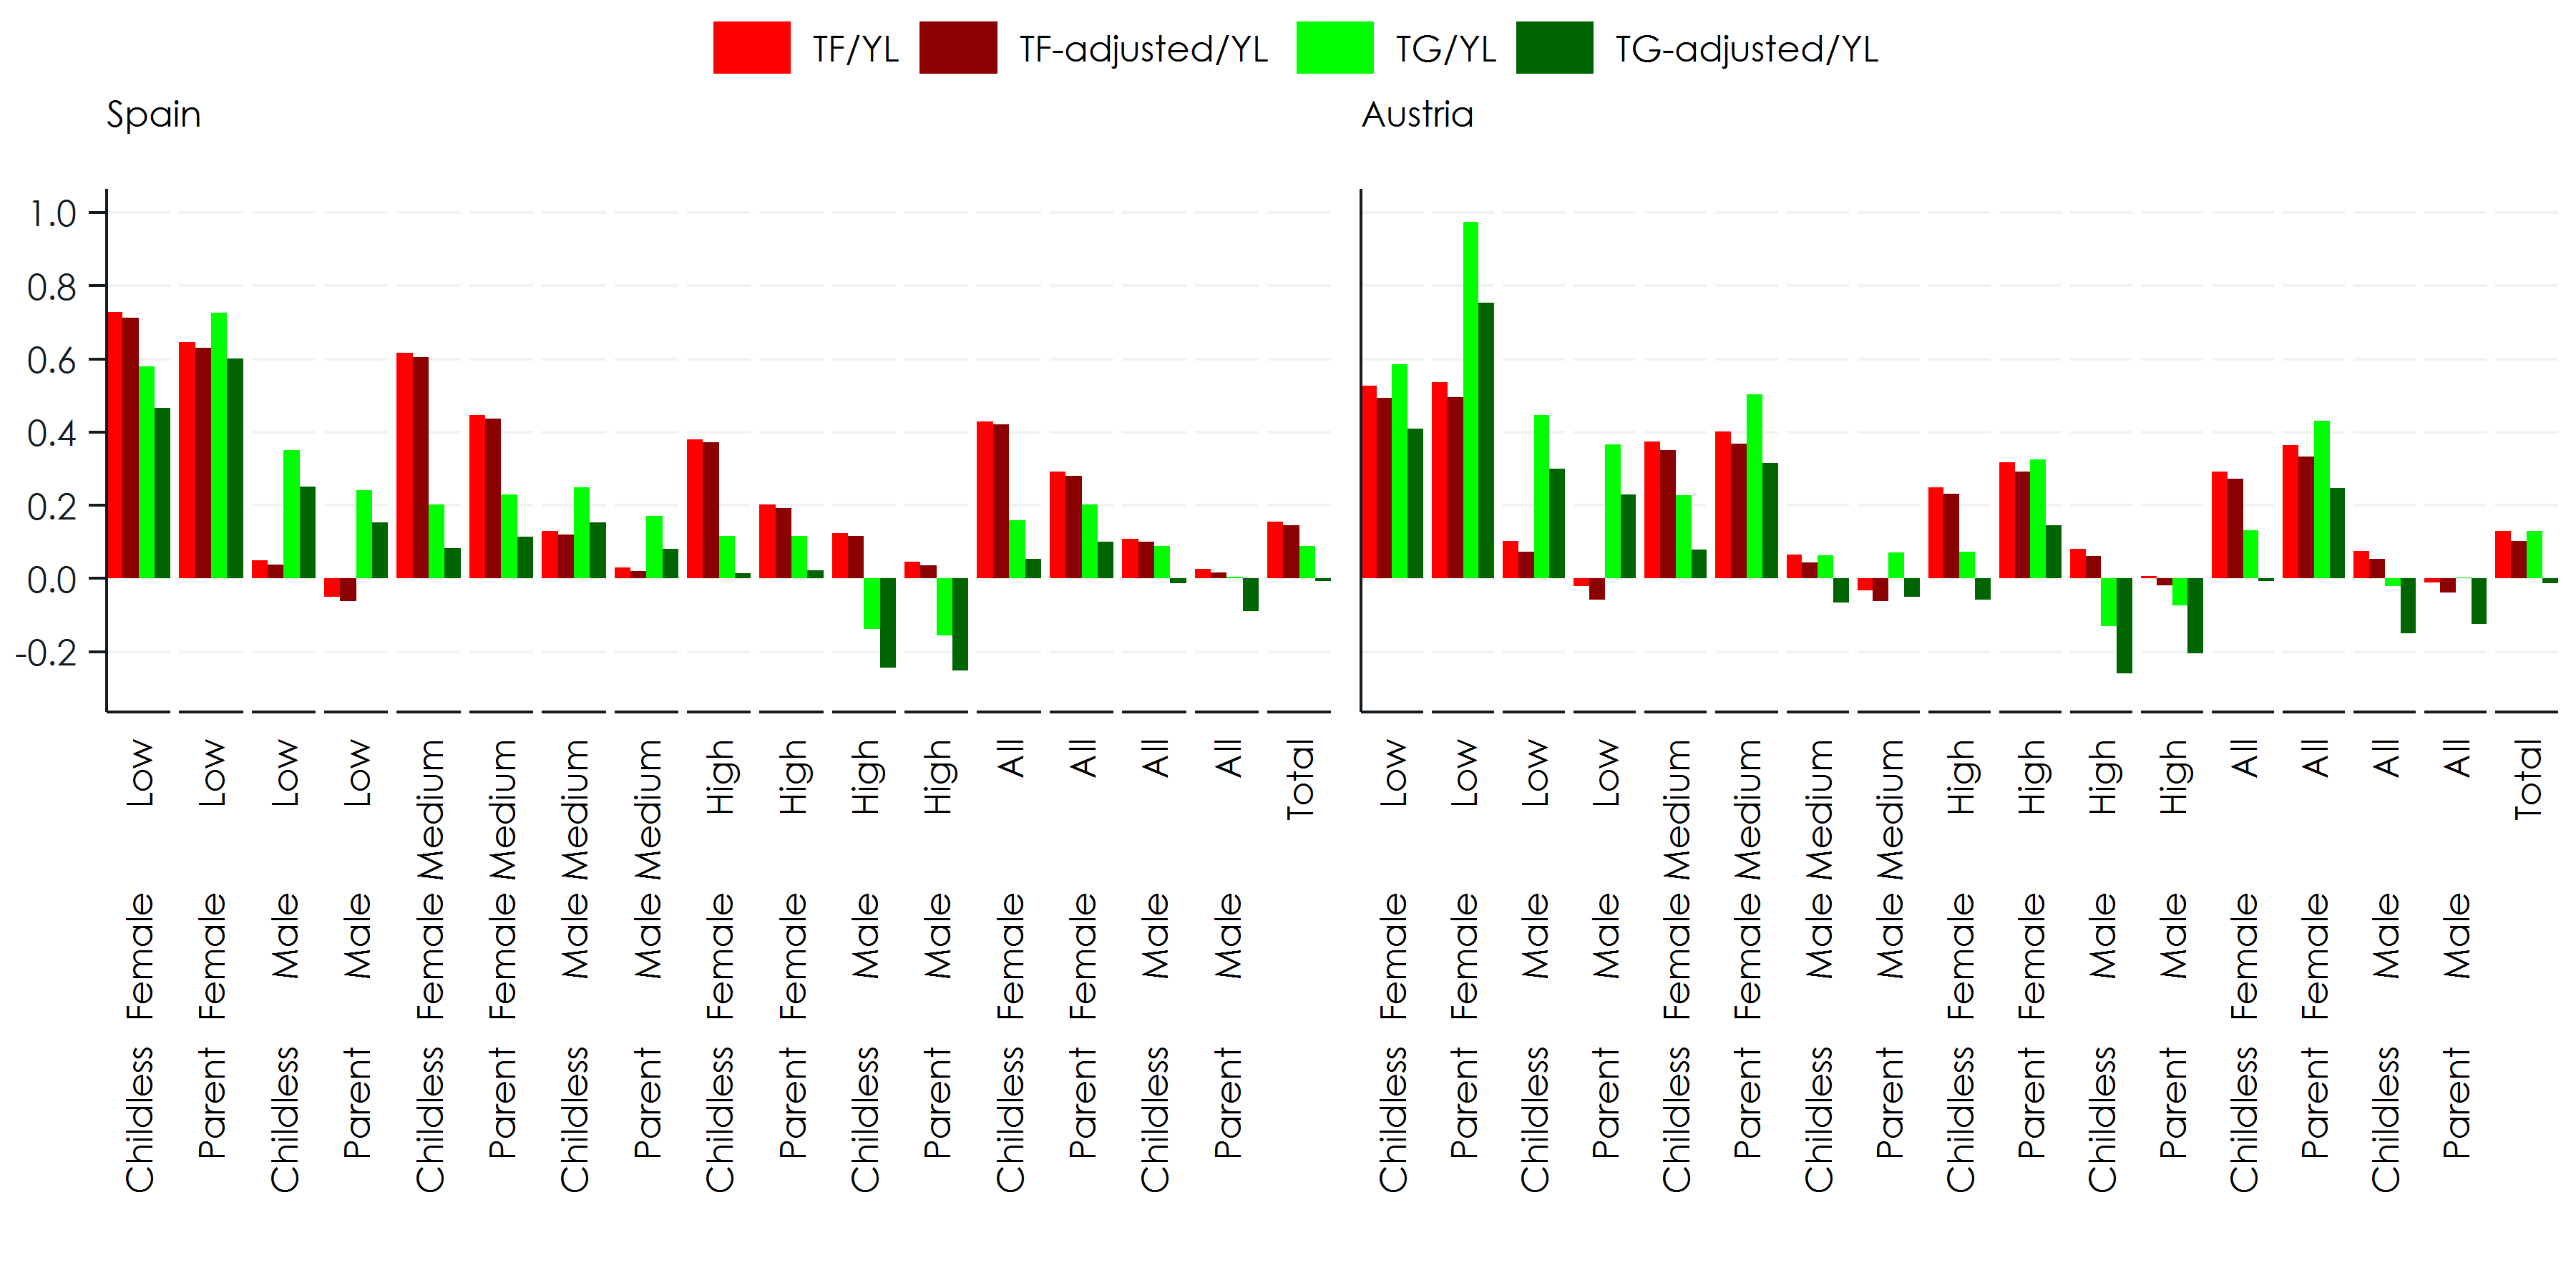 Figure 8
Note: Net present value of private and public transfers as proportion of labour income W/O balancing bugets – 2010 birth cohorts.
Figure 8
Note: Net present value of private and public transfers as proportion of labour income W/O balancing bugets – 2010 birth cohorts.
Figure 9 shows Generational Accounts in 2010 for cohorts born in the base year or before, i.e. age 0 to 100 in 2010. While again representing net present values (NPV), only the values for age 0 include the full lifecycle payments of the cohort; for all other cohorts, the values refer to the remaining lifetime transfers. Net private transfers are positive for children and negative for cohorts currently in working age, tending to zero afterwards. Public transfers are also positive for children and negative for working ages. Nevertheless, they become strongly positive for the elderly. Regarding the discounting effect, a positive discount rate reduces the present value of net transfers more, the farther they are from the initial year. The initial value of GA in Figure 9 is the same shown in the preceding figures (adjusted or not). For the average individual, it is positive both for public and private transfers. When children start growing up, two forces are interacting. On the one hand, the transfers left to be received are lower, and this reduces GA. On the other hand, the payments to be made during working age become closer, reducing GA as well. Both effects explain the decreasing trend at the beginning. When young adults enter the labour market, the payments to the public sector start, as well as transfers to own children, so that remaining payments start decreasing. This explains the increasing path of GA for both TF and TG. The private GA tends to zero, while an additional effect occurs for public transfers. As adults age, the future pension receipts become closer, and GA continues increasing until they retire and start receiving pensions so that the transfers left decrease again tending to zero. The age path of total transfers follows this evolution, being at the end mainly driven by public transfers, as private transfers become close to zero. This age pattern is reproduced at all education levels.
Figure 9: Full Generational Accounts for living generations by education level
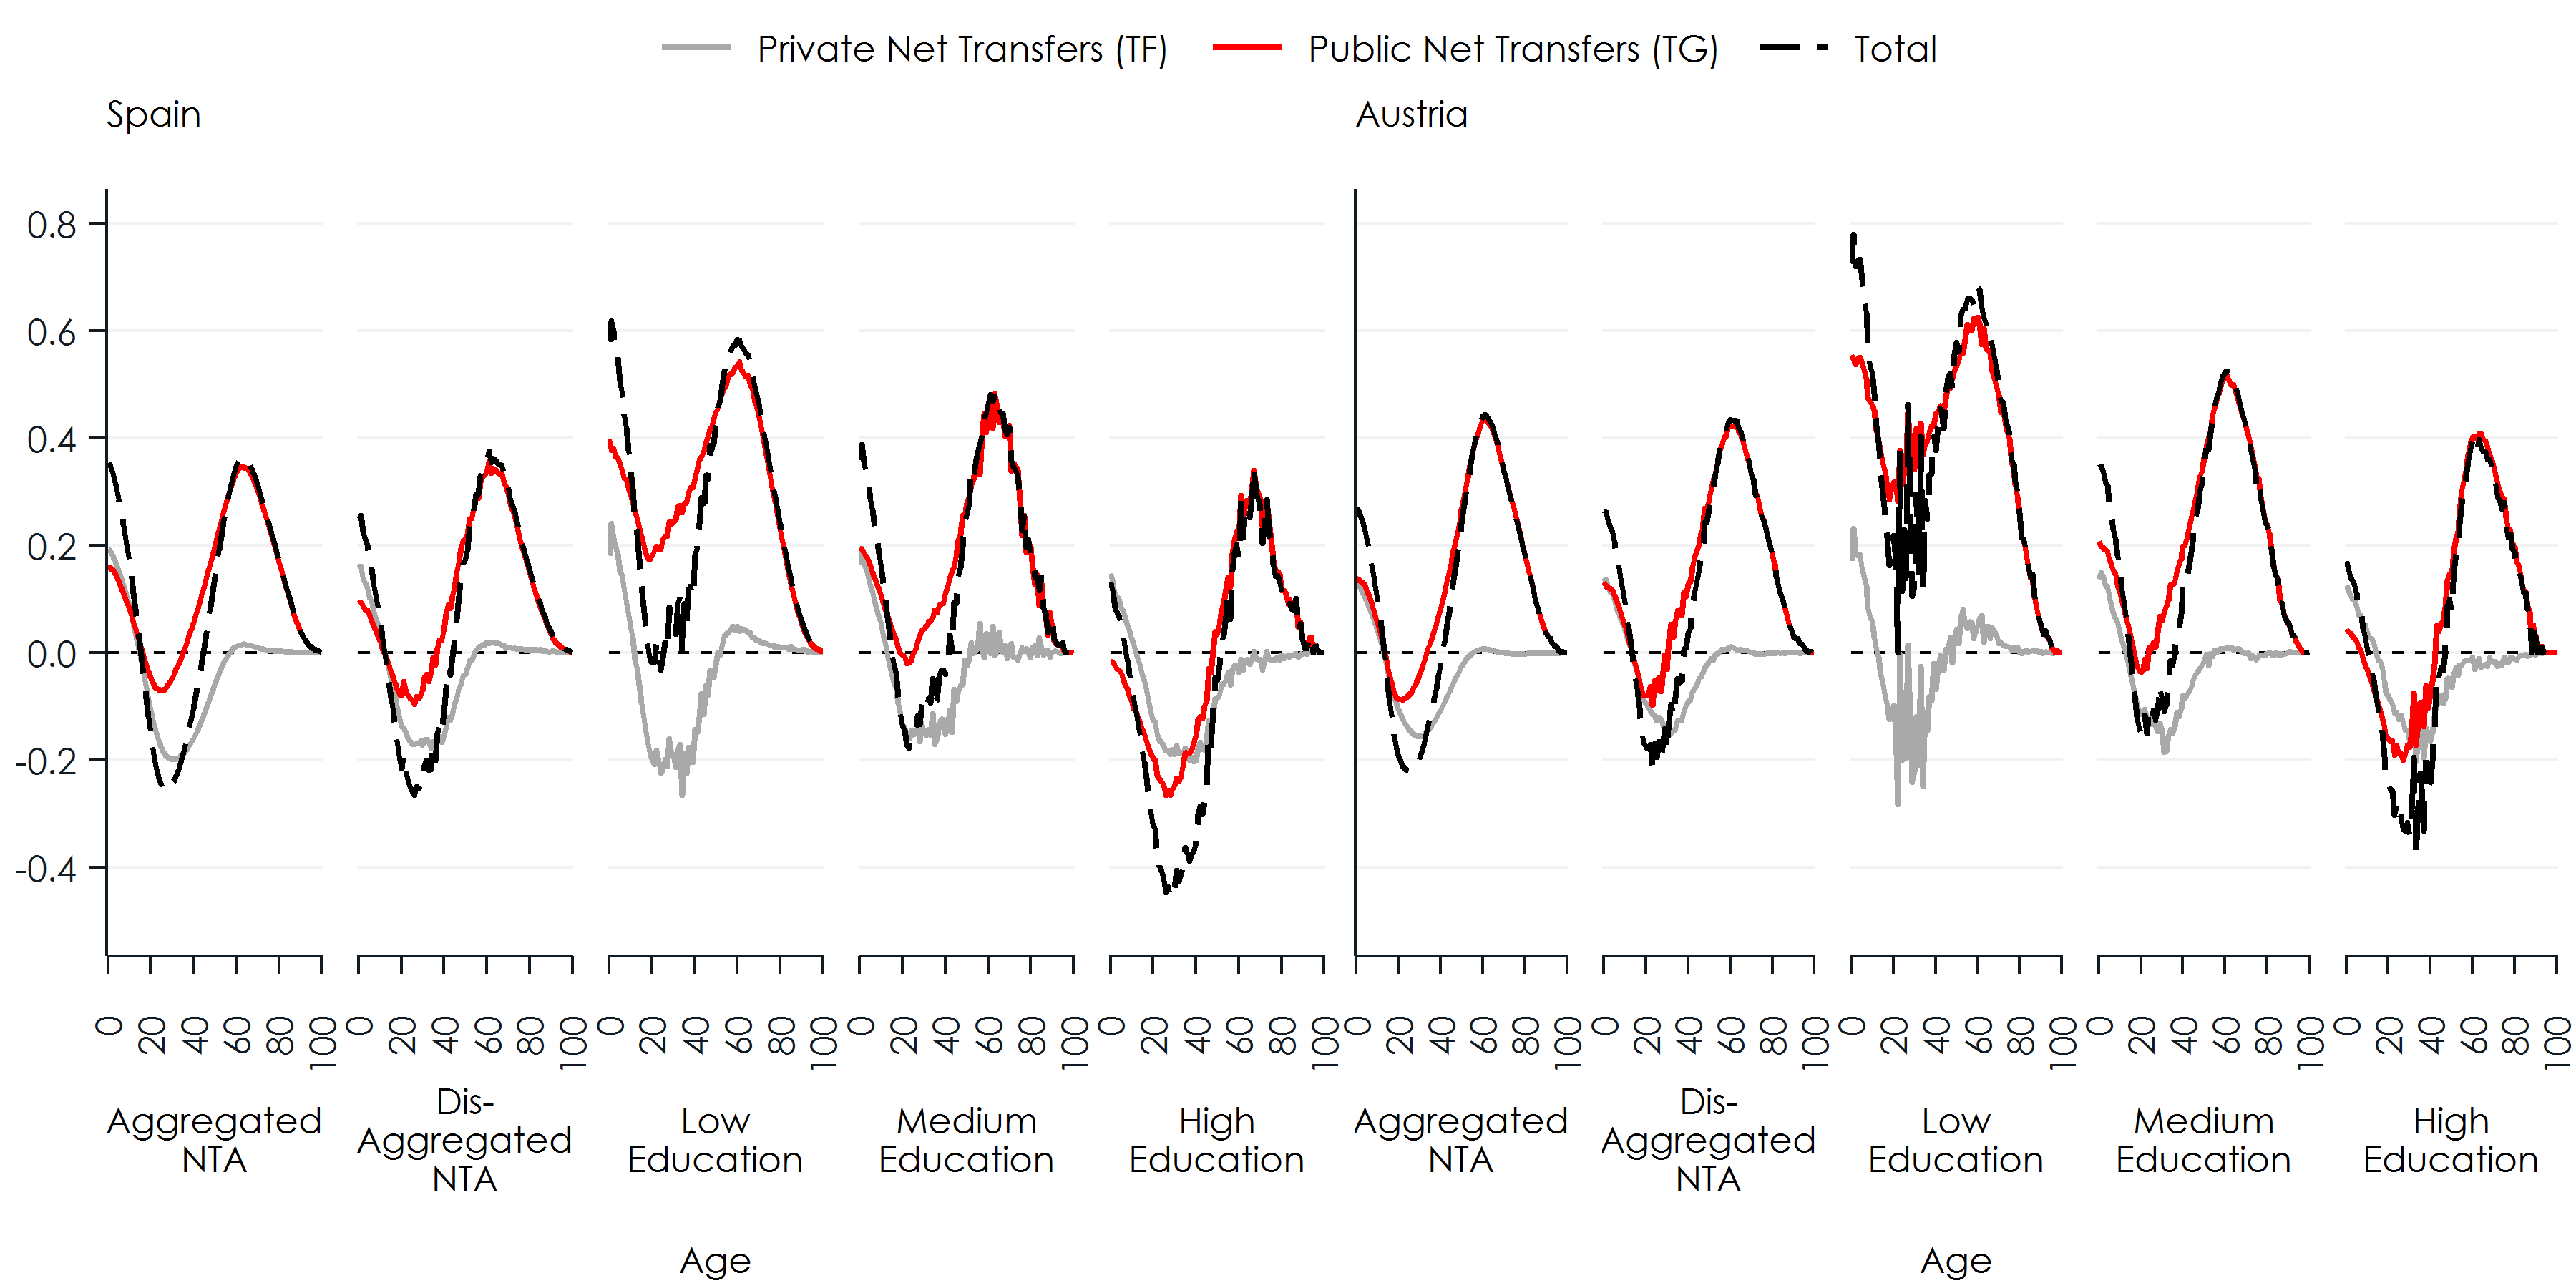 Figure 9
Note: Full Generational Accounts – net present value in 2010 of future lifetime transfers by age as proportion of the present value of lifetime labour income of a new-born in 2010, no adjustments to balance budgets.
Figure 9
Note: Full Generational Accounts – net present value in 2010 of future lifetime transfers by age as proportion of the present value of lifetime labour income of a new-born in 2010, no adjustments to balance budgets.
Figure 10 shows the same results further disaggregated by education level and by family type. The pattern of private transfers differs clearly between childless and parents – the latter giving substantial more during working lives. While in both countries, parents privately transfer substantially more money to others, the Austrian welfare state fully compensates for these differences through public transfers to parents. Such compensation is not observed in Spain.
Figure 10: Full Generational Accounts for living generations by family type and education level
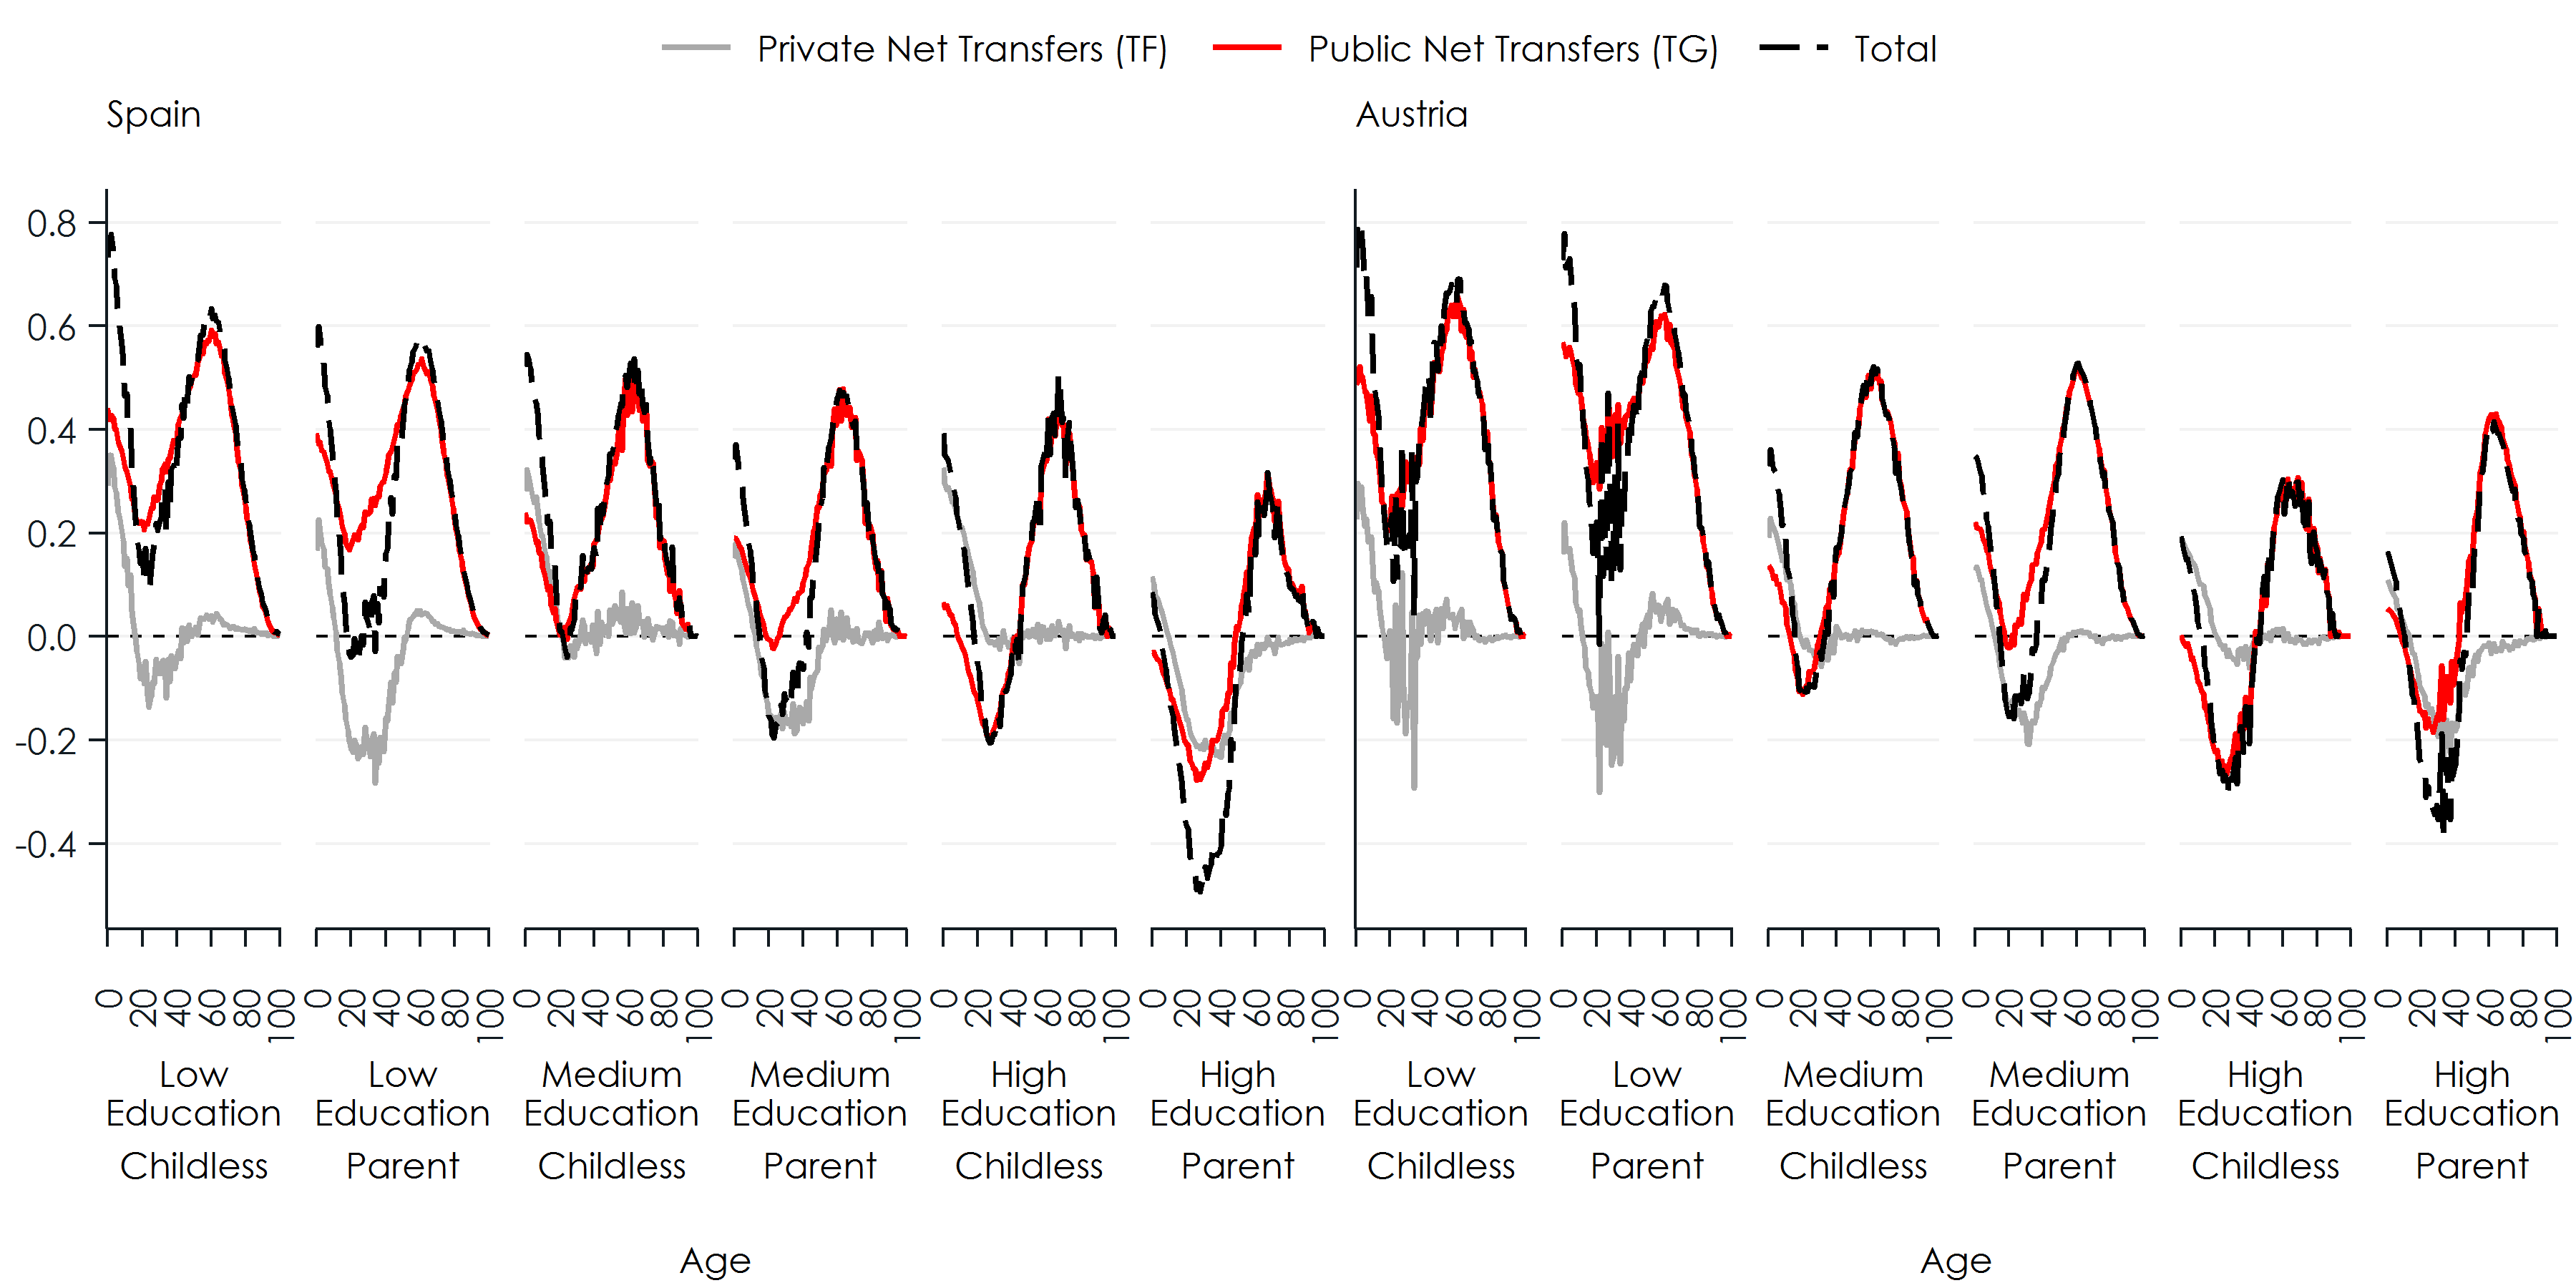 Figure 10
Note: Full Generational Accounts – net present value in 2010 of future lifetime transfers by age as proportion of lifetime labour income of a new-born in 2010, no adjustments to balance budgets.
Figure 10
Note: Full Generational Accounts – net present value in 2010 of future lifetime transfers by age as proportion of lifetime labour income of a new-born in 2010, no adjustments to balance budgets.
Finally, Figure 11 illustrates how the adjustments required to balance budgets affect currently living generations. Recall that the balancing mechanism employed in our simulation adjusts both taxes and transfers proportionally so that the budget is balanced annually. The Figure shows the present value of the adjustments in relation to the present value of labour income of the 2010 birth cohort. With up to 20%, private and public adjustments together are double as high in Austria than in Spain. In both countries, the bulk of adjustments concern public transfers. In Austria, these adjustments over-proportionally hit lower educated people and parents, reducing the redistributive effect of the welfare state in both the educational and family dimensions. In contrast, adjustments are almost identical across groups in Spain.
Figure 11: The effect of budget adjustments on Generational Accounts
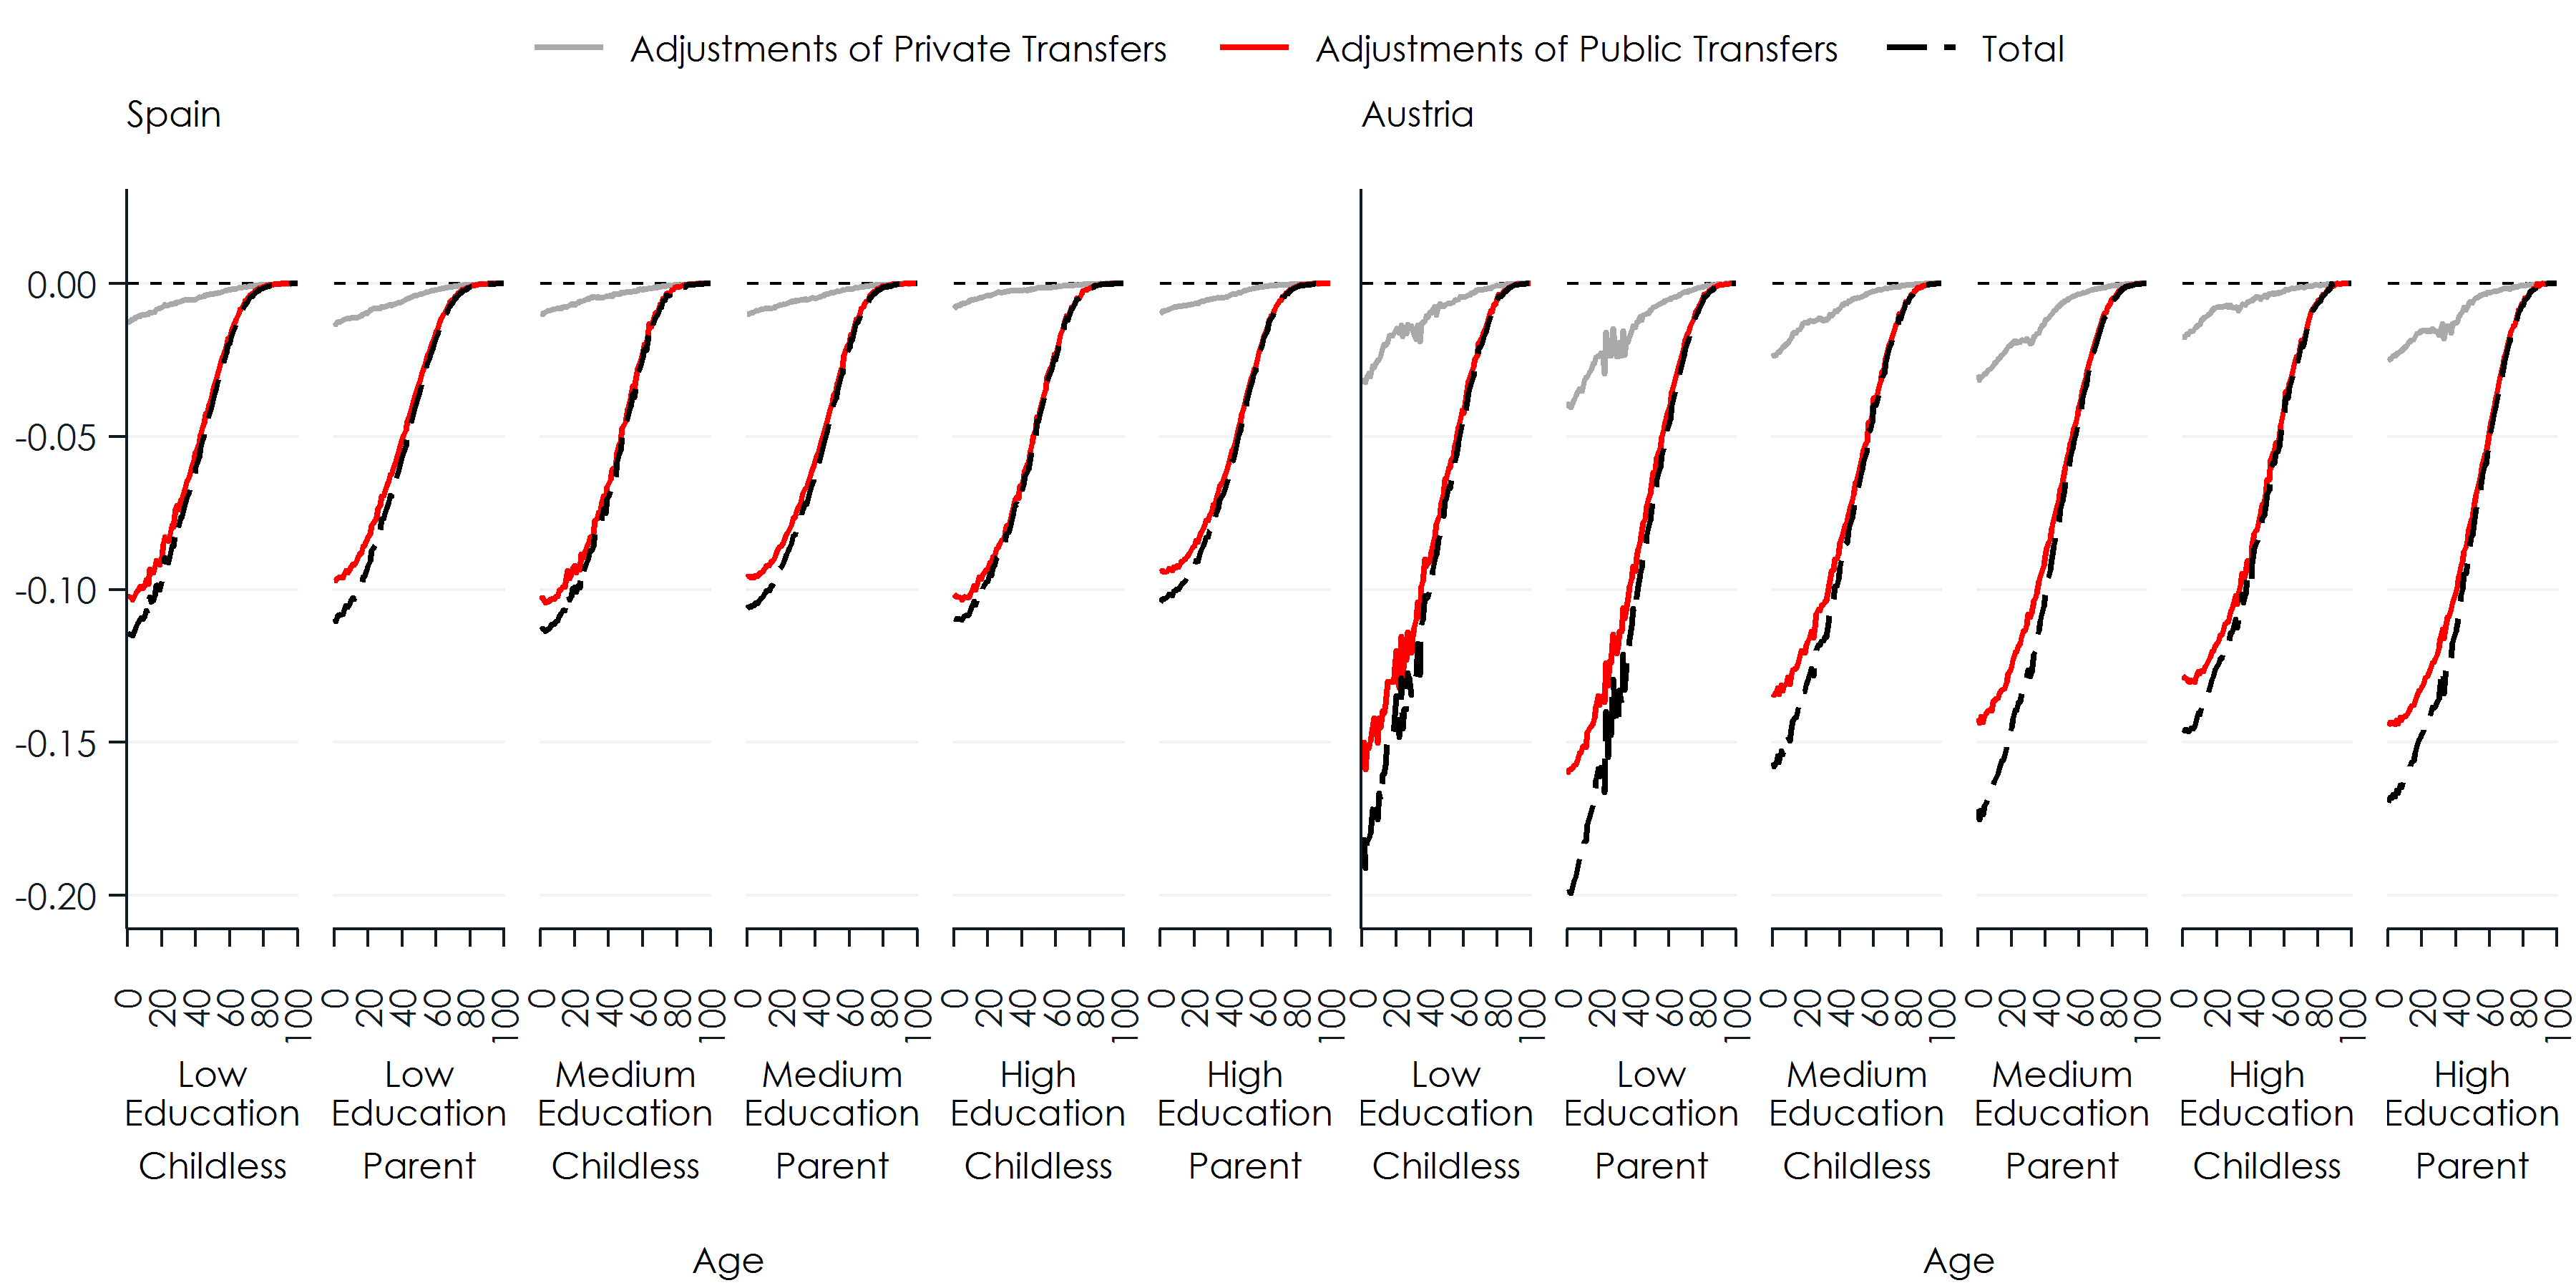 Figure 11
Note: Full Generational Accounts, required budget adjustments as proportion of the present value of lifetime labour income of a new-born in 2010.
Figure 11
Note: Full Generational Accounts, required budget adjustments as proportion of the present value of lifetime labour income of a new-born in 2010.
Summary and Discussion
This paper combines different approaches present in the literature to investigate the impact of population ageing on the inter and intragenerational income redistribution from a longitudinal perspective. In particular, we incorporated new disaggregated National Transfer Account (NTA) data and concepts of generational accounting into the dynamic microsimulation model microWELT. This approach allows projecting lifetime measures of transfers by cohort, gender, education group and family characteristics. We calculated expected Full Generational Accounts (including public and private transfers) of currently living and future generations in Austria and Spain. The aggregate Generational Account for public net transfers for generations born in 2011 is positive and amounts to around 15% of the present value of labour income in both countries. The adjustment required to balance budgets in the context of population ageing reduces this value to zero. Disaggregating NTA introduces substantial differences. The net payments by education level differ substantially from the high to the low education group (from 55% to 5% of the PV of labour income in Austria and from 40 to -1% in Spain). In both countries, the high educated remain the only net taxpayers when the budget is balanced. Before adjusting the budgets, the size of the average NPV of private transfers for the cohort born in 2010 is substantially higher than for public transfers in Spain, while these numbers are similar in Austria, reflecting the substitution of private transfers by public transfers as the size of the welfare state increases. The model includes balancing mechanisms to adjust public and private transfers to meet the corresponding budget constraints. Public transfers need to be adjusted to a greater extent, NPVs becoming negative for the high educated. The required adjustment of private transfers is more limited. When looking at disaggregated results by family type, we observe that private transfers are in absolute terms higher for childless individuals than for parents. Childless individuals receive transfers from their parents while young, but do not transfer resources to children during their working age. We observe different outcomes for Austria and Spain for public transfers. In both countries, mothers receive more than childless women, especially in Austria. However, in the case of men, Austria and Spain show opposite patterns. In Austria, fathers receive slightly more (or pay less in the case of high educated), while in Spain the childless are the most benefitted. This is explained by differential treatment both in terms of tax payments and in terms of transfer receipts. Spanish fathers pay almost 14% more and receive only 2.9% more, while these figures are 5.4 and 8.7% in the case of Austria. This means that being a father in Austria implies receiving more in net terms, while in Spain fathers receive less than childless males from the public sector. In Austria, higher private transfers given by parents are compensated to a large extent by public transfers, a pattern not found in Spain. Further research is needed in order to investigate the impact of redistributive policies along the life cycle. Our immediate plans are incorporating two more countries in the analysis, representative of the Anglo-Saxon and Nordic welfare models, in order to analyse the impact of welfare models on this issue. We aim at linking balancing mechanisms to welfare state regimes, accounting for the transfer type and socio-economic characteristics of affected population groups.
References
- Abio, G., Patxot, C., Souto, G., Istenič, T. (2020), Disaggregated National Transfer Accounts by Education and Family Types for Spain, UK, Austria, and Finland. University of Barcelona Working Paper 2020, forthcoming.
- Auerbach, A., Gokhale, J., Kotlikoff, L. (1991), Generational accounting: a meaningful alternative to deficit accounting. Tax Policy and the Economy, 5, 55-110.
- Auerbach, A., Kotlikoff, L., Leibfritz, W. (1999), Generational accounting around the World. Chicago: University of Chicago Press.
- Bonin, H. (2001), Generational accounting: theory and application. Berlin: Springer.
- Bonin, H. and C. Patxot (2004), Generational Accounting as a Tool to Assess Fiscal Sustainability: An Overview of the Methodology, IZA Discussion Papers 990, Institute of Labor Economics (IZA).
- European Commission (1999), Generational Accounting in Europe, European Economy Reports and Studies 1999/6.
- Istenič, T., Šeme, A., Hammer, B., Lotrič Dolinar, A., Sambt, J. (2016), The European NTA Manual. AGENTA Public Deliverable. Download from: http://www.agenta-project.eu/Jacomo/upload/publications/d-1.4-submitted.pdf (Accessed on 11 November 2020).
- Lee, R., McCarthy, D., Sefton, J., Sambt, J. (2017), Full Generational Accounts: What Do We Give to the Next Generation? Population and Development Review 43(4): 695-720.
- Patxot C, Renteria E, Sánchez Romero M, Souto G (2012), Measuring the balance of government intervention on forward and backward family transfers using NTA estimates: the modified Lee arrows, International Tax and Public Finance, 19, 442-461.
- Patxot, C., Renteria, E., Sánchez-Romero, M., Souto, G. (2011), Integrated results for GA and NTA for Spain: some implications for the sustainability of welfare state, Moneda y Crédito, 23:7-51.
- Sánchez-Romero, M., Abío, G., Botey, M., Prskawetz, A., Sambt, J., Sole, M., Souto, G., Vargha, L., Patxot, C. (2019), Welfare state winners and losers in ageing societies Vienna Yearbook of Population Research 2019 (Volume 17), 9-36.
- Spielauer, M., Horvath, Th., Fink, M. (2020a), microWELT: A Dynamic Microsimulation Model for the Study of Welfare Transfer Flows in Ageing Societies from a Comparative Welfare State Perspective. WIFO Working Paper, 609, 2020.
- Spielauer, M., T. Horvath, W. Hyll, M. Fink (2020b), microWELT: Sociodemographic Parameters and Projections for Austria, Spain, Finland and the UK. WIFO Working Paper, 611, 2020.
- Spielauer, M., T. Horvath, M. Fink, G. Abio, G. Souto Nieves, C. Patxot, T. Istenič (2020c), microWELT: Microsimulation Projection of Indicators of the Economic Effects of Population Ageing Based on Disaggregated National Transfer Accounts. WIFO Working Paper 612, 2020.
- United Nations (2013), National Transfer Accounts Manual: Measuring and Analysing the Generational Economy. United Nations Publications. https://www.un.org/en/development/desa/population/publications/pdf/development/Final_March2014.pdf (Accessed on 11 November 2020).